Comparative Study
. 2010 Apr;7(2):26004.
doi: 10.1088/1741-2560/7/2/026004. Epub 2010 Mar 2.

Optimal spacing of surface electrode arrays for brain-machine interface applications

Affiliations
Comparative Study

Optimal spacing of surface electrode arrays for brain-machine interface applications

Marc W Slutzky et al. J Neural Eng. 2010 Apr.

Abstract

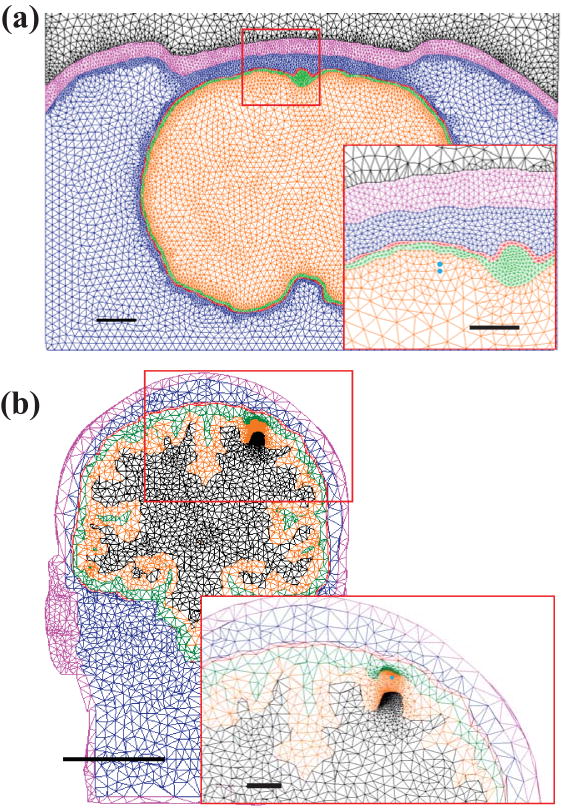
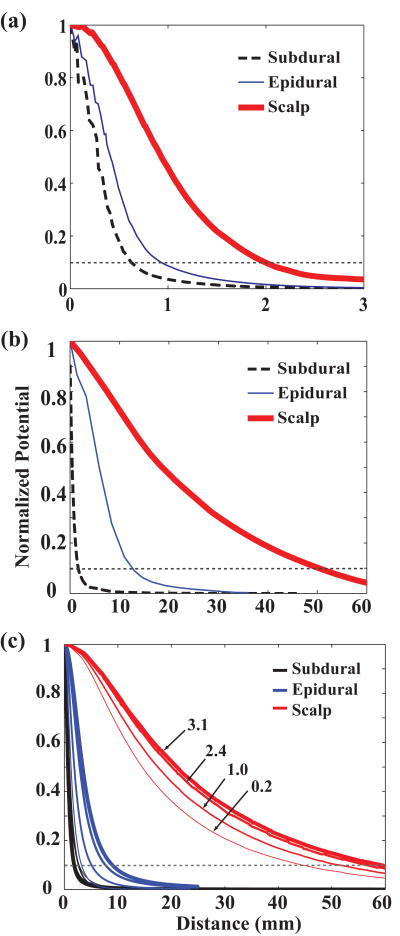
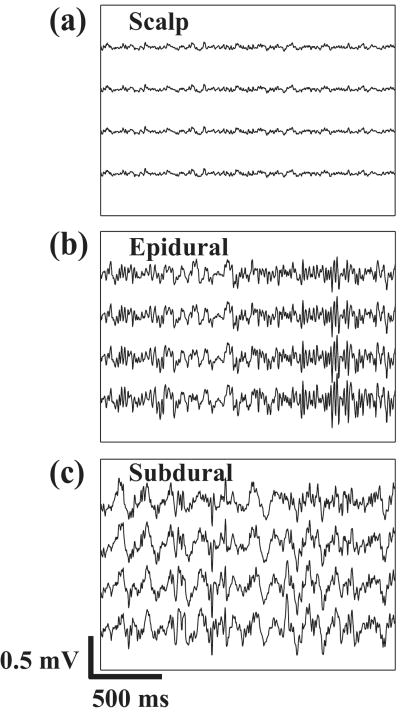
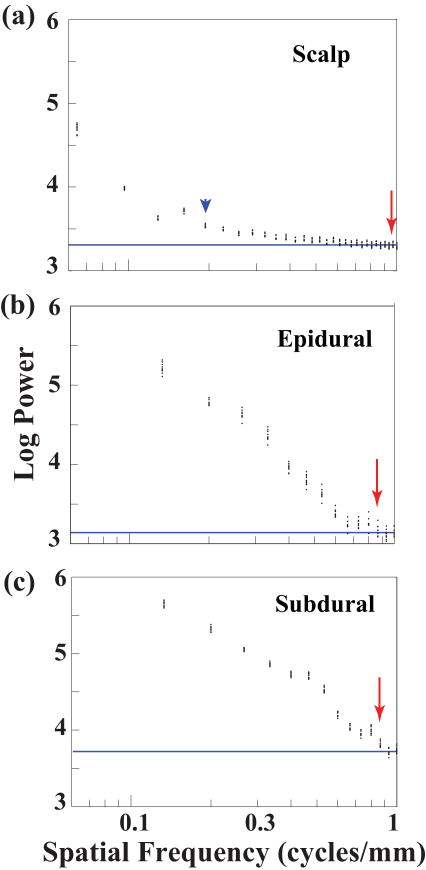
Brain-machine interfaces (BMIs) use signals recorded directly from the brain to control an external device, such as a computer cursor or a prosthetic limb. These control signals have been recorded from different levels of the brain, from field potentials at the scalp or cortical surface to single neuron action potentials. At present, the more invasive recordings have better signal quality, but also lower stability over time. Recently, subdural field potentials have been proposed as a stable, good quality source of control signals, with the potential for higher spatial and temporal bandwidth than EEG. Here we used finite element modeling in rats and humans and spatial spectral analysis in rats to compare the spatial resolution of signals recorded epidurally (outside the dura), with those recorded from subdural and scalp locations. Resolution of epidural and subdural signals was very similar in rats and somewhat less so in human models. Both were substantially better than signals recorded at the scalp. Resolution of epidural and subdural signals in humans was much more similar when the cerebrospinal fluid layer thickness was reduced. This suggests that the less invasive epidural recordings may yield signals of similar quality to subdural recordings, and hence may be more attractive as a source of control signals for BMIs.


Figures

Figure 1
Figure 1
Schematic of segmented coronal images of (a) rat and (b) human heads. Layers from the inside out are gray matter, CSF, dura, skull, scalp, and air. Dipole location (not actual size) is shown by the blue dots (inset). Scale bars represent (a) 1 mm (0.5 mm inset) for rats and (b) 50 mm (10 mm inset) for humans.
Figure 2
Figure 2
An idealized spatial spectrum. The dotted line represents the spectrum of one 4,000 point subset of the data. Fc marks the upper end of the spatial passband above which the signal becomes dominated by white noise.
Figure 3
Figure 3
Finite element model normalized potential distributions. (a) Rat realistic head model. Subdural (black dashed) and epidural (blue thin) potentials cross the 10% line (gray dotted) at 0.5 and 0.7 mm, while scalp (thick red) crosses at 2.2 mm. (b) Human realistic head model. Epidural potential is broader than subdural but still much sharper than scalp. (c) Human spherical model using CSF thicknesses from 0.2 to 3.1 mm. As CSF layer gets thinner (thinner lines), epidural (blue) and scalp (red) curves sharpen dramatically and epidural potential approaches subdural potential (black).
Figure 4
Figure 4
Sample recordings from four neighboring electrodes in one acute experiment at (a) scalp, (b) epidural, and (c) subdural locations. Signals were band-pass filtered from 5-180 Hz. Amplitudes were noticeably smaller at the scalp than at epidural or subdural locations.
Figure 5
Figure 5
Spatial spectra for recordings from the same rat at (a) scalp, (b) epidural, and (c) subdural locations. Each 4,000-point segment of data yields one spatial spectral estimate. Since there are 10 data segments, this translates to 10 data points at each spatial frequency. Inspection of the scalp spectrum suggests that the spatial bandwidth should be closer to 0.19 c/mm (blue arrowhead) rather than the bandwidth found by the t-test method (red arrow). Epidural and subdural locations have much higher spatial bandwidths (red arrows) than scalp. Baseline in each panel is denoted by the solid blue line.
Figure 6
Figure 6
Epidural signals recorded from a chronically implanted, moving rat. All 16 channels are shown.
Figure 7
Figure 7
Spatial spectra from the epidural signals corresponding to Figure 6. The spatial bandwidth (red arrow) is approximately the same for this moving rat as for the anesthetized rat in Figure 5(b). Baseline is denoted by solid blue line.
Figure 8
Figure 8
Mean (±sd) optimal spacing estimates for acute (scalp, epidural, subdural, n=11) and chronic (anesthetized, awake, n=10) conditions. Epidural and subdural spacings were very similar in the acute experiments, and there was no difference between awake/moving and anesthetized states in chronic epidural experiments.

References

    1. Birbaumer N, Ghanayim N, Hinterberger T, Iversen I, Kotchoubey B, Kubler A, Perelmouter J, Taub E, Flor H. A spelling device for the paralysed. Nature. 1999;398:297–8. - PubMed
    1. Wolpaw JR, McFarland DJ. Control of a two-dimensional movement signal by a noninvasive brain-computer interface in humans. Proc Natl Acad Sci U S A. 2004;101:17849–54. - PMC - PubMed
    1. Hochberg LR, Serruya MD, Friehs GM, Mukand JA, Saleh M, Caplan AH, Branner A, Chen D, Penn RD, Donoghue JP. Neuronal ensemble control of prosthetic devices by a human with tetraplegia. Nature. 2006;442:164–71. - PubMed
    1. Pohlmeyer EA, Perreault EJ, Slutzky MW, Kilgore KL, Kirsch RF, Taylor DM, Miller LE. Use of Intracortical Recordings to Control a Hand Neuroprosthesis. Neural Engineering, 2007 CNE '07 3rd International IEEE//EMBS Conference on; 2007. pp. 418–20.
    1. Moritz CT, Perlmutter SI, Fetz EE. Direct control of paralysed muscles by cortical neurons. Nature. 2008;456:639–42. - PMC - PubMed

Publication types