. 2010 Mar;120(3):681-93.
doi: 10.1172/JCI40535. Epub 2010 Feb 8.

A novel type of cellular senescence that can be enhanced in mouse models and human tumor xenografts to suppress prostate tumorigenesis

Affiliations

A novel type of cellular senescence that can be enhanced in mouse models and human tumor xenografts to suppress prostate tumorigenesis

Andrea Alimonti et al. J Clin Invest. 2010 Mar.

Abstract

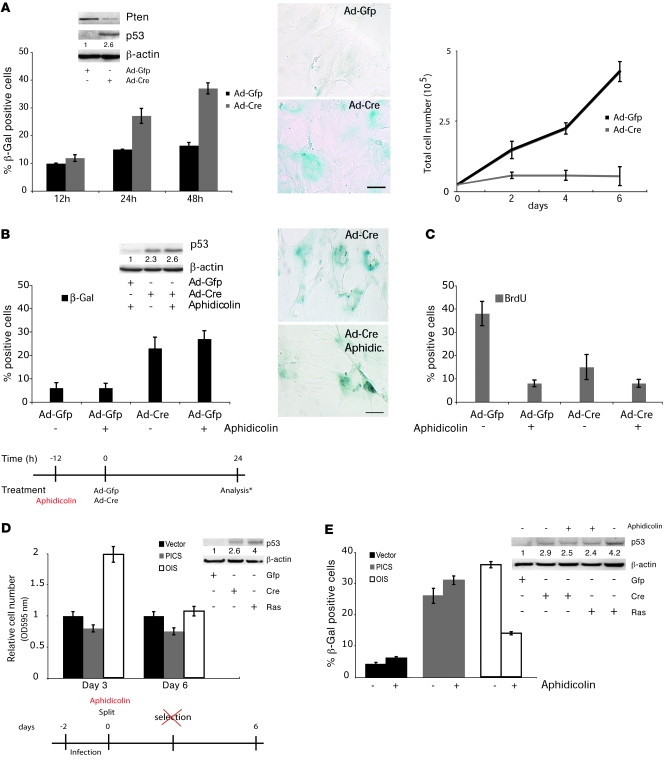
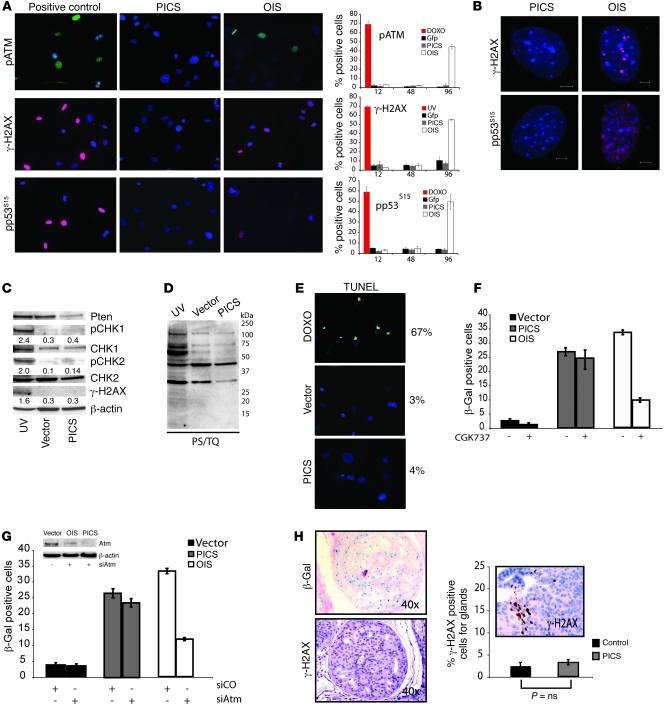
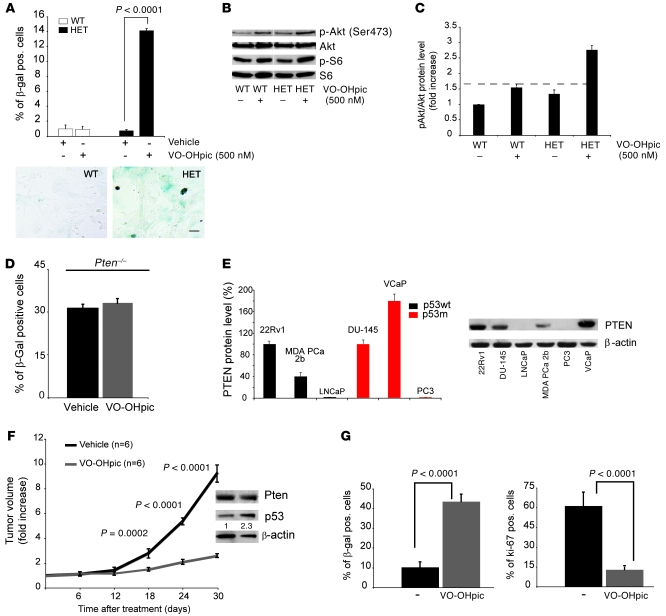
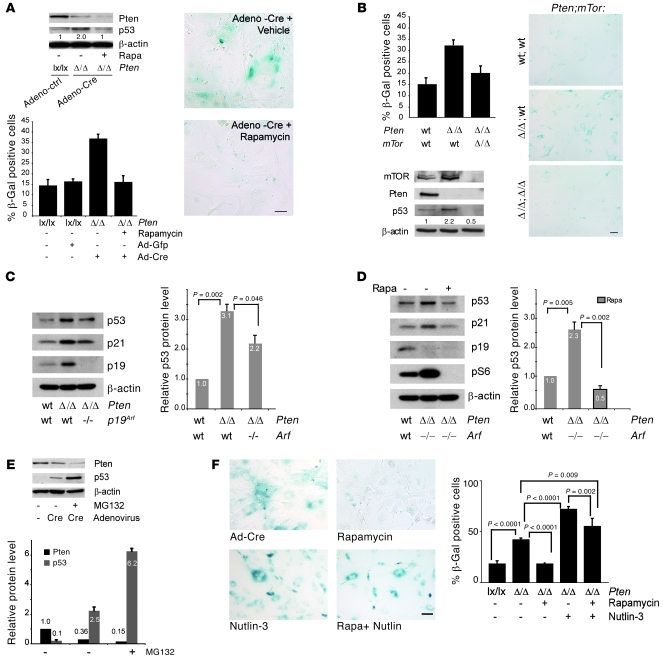
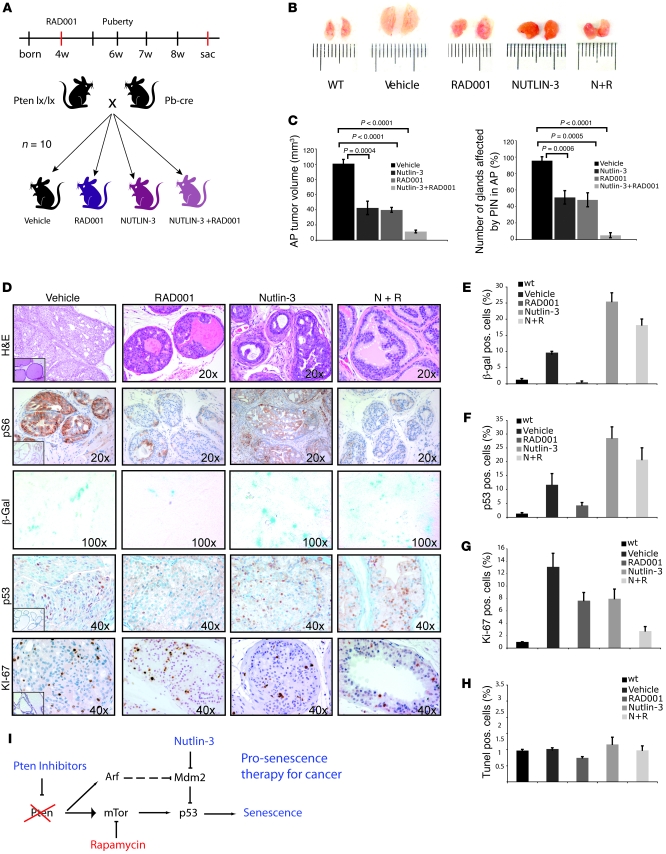
Irreversible cell growth arrest, a process termed cellular senescence, is emerging as an intrinsic tumor suppressive mechanism. Oncogene-induced senescence is thought to be invariably preceded by hyperproliferation, aberrant replication, and activation of a DNA damage checkpoint response (DDR), rendering therapeutic enhancement of this process unsuitable for cancer treatment. We previously demonstrated in a mouse model of prostate cancer that inactivation of the tumor suppressor phosphatase and tensin homolog deleted on chromosome 10 (Pten) elicits a senescence response that opposes tumorigenesis. Here, we show that Pten-loss-induced cellular senescence (PICS) represents a senescence response that is distinct from oncogene-induced senescence and can be targeted for cancer therapy. Using mouse embryonic fibroblasts, we determined that PICS occurs rapidly after Pten inactivation, in the absence of cellular proliferation and DDR. Further, we found that PICS is associated with enhanced p53 translation. Consistent with these data, we showed that in mice p53-stabilizing drugs potentiated PICS and its tumor suppressive potential. Importantly, we demonstrated that pharmacological inhibition of PTEN drives senescence and inhibits tumorigenesis in vivo in a human xenograft model of prostate cancer. Taken together, our data identify a type of cellular senescence that can be triggered in nonproliferating cells in the absence of DNA damage, which we believe will be useful for developing a "pro-senescence" approach for cancer prevention and therapy.


Figures

Figure 1
Figure 1. Senescence driven by Pten loss occurs in the absence of cellular proliferation.
(A) Western blot analysis of Ptenlx/lx MEFs infected with Ad-GFP or Ad-Cre, according to the scheme in Supplemental Figure 1E. β-gal staining for senescence and its quantification. Scale bar: 10 μm. Growth curve of Ptenlx/lx MEFs after infection with Ad-GFP or Ad-Cre. (B) Quantification of β-gal staining for senescence and Western blot analysis for p53 in Ptenlx/lx MEFs treated according to the experimental timeline. The asterisk denotes analysis through either Western blotting or β-gal staining. Images show β-gal staining for senescence (at 24 hours). Scale bar: 10 μm. (C) Quantification of BrdU incorporation in Ptenlx/lx MEFs infected as in B. (D) Analysis of cellular proliferation and Western blot analysis for p53 of Ptenlx/lx primary MEFs infected with retroviral control vector, H-Ras (OIS), and Cre (PICS), as measured by relative cell number over a 6-day period, and followed without selection. Note that the absence of selection was required, since H-Ras induced hyperproliferation 2 days after the infection of MEFs (a shorter time point than that observed in human cell lines; ref. 18), and the selection phase masked this phenomenon. Experimental design for the experiment is shown in the lower panel. (E) Quantification of β-gal staining and Western blot analysis for p53 at day 6 for Ptenlx/lx primary MEFs infected as in D (see experimental design in D). Numbers in the Western blots indicate densitometrically determined protein levels relative to β-actin (A, B, D, and E). Error bars show SD (AE).
Figure 2
Figure 2. Senescence driven by Pten loss occurs in the absence of DNA damage.
(A) Immunofluorescence staining and its quantification to detect SDF in primary Ptenlx/lx MEFs undergoing Cre (PICS) and H-Ras infection (OIS). Representative images of phospho-ATM (pATM), γ-H2AX, and phospho-p53 (Ser15) (pp53S15) staining. MEFs treated with doxorubicin (DOXO) and UV were used as controls as indicated. (B) Representative images of γ-H2AX and phospho-p53 DNA damaged foci in MEFs treated as in A. Scale bar: 5 μm. (C) Western analysis for DDR markers in UV-treated primary WT MEFs, proliferating primary MEFs (vector), or MEFs undergoing PICS. Numbers in Western blots indicate protein levels for pCHK1, pCHK2, and γ-H2AX relative to β-actin. (D) Western analysis for substrates phosphorylated by ATM/ATR (phospho-S/TQ, PS/TQ) in UV-treated, control, and PICS. (E) TUNEL analysis in proliferating MEFs or MEFs undergoing PICS. WT MEFs treated with doxorubicin were used as a control. (F) Quantification of β-gal staining (at day 6) in Ptenlx/lx MEFs infected as in A and treated with the ARM/ATR inhibitor CGK737 after infection. (G) Quantification of β-gal staining in MEFs infected as in A and transfected with either a control (siCO) or ATM-specific siRNA (siAtm). Western-blot analysis for ATM in MEFs infected and treated as indicated. (H) β-gal and phospho–γ-H2AX staining and its quantification in prostates from 8-week-old Ptenpc–/– mice with prostatic intraepithelial neoplasia. The graph shows γ-H2AX staining in a positive control (a Ptenpc–/– mouse with invasive carcinoma). P values were determined by Student’s t test. Error bars show SD (A and FH). Original magnification, ×10 (A and E); ×200 (inset in H).
Figure 3
Figure 3. Pharmacological inhibition of PTEN drives senescence in vitro and in vivo.
(A) Quantification of the senescence-associated β-gal assay and its staining in Pten+/+ (WT) and Pten+/– (HET) cells treated with indicated concentrations of the PTEN inhibitor VO-OHpic. Scale bar: 10 μm. Error bars show SD. (B) Western analysis of cells from A treated with 500 nM VO-OHpic. Blot lanes were run on the same gel but were noncontiguous. (C) Quantification of pAkt (Ser 473)/Akt protein levels in Pten+/+ and Pten+/– MEFs from A, normalized for the WT baseline level (dashed line). Error bars show SD from independent experiments. (D) Quantification of senescence-associated β-gal staining in Pten-null MEFs treated with either vehicle or 500 nM VO-OHpic. Error bars show SD. (E) Western analysis for PTEN and its quantification in 6 prostate cancer cell lines with WT (black bars) and mutant (red bars) p53. Error bars show SD from independent experiments. (F) Fold increase in tumor volume in a MDA PCa 2b xenograft mouse model after systemic treatment with VO-OHpic. Error bars show SD. A representative Western blot analysis for p53 in tumors from mice treated with Vehicle or VO-OHpic is shown in the inset. Numbers in the inset indicate densitometrically determined protein levels for p53 relative to β-actin (G) Quantification of β-gal– and Ki-67–positive cells in MDA PCa 2b tumors, untreated and treated with VO-OHpic. Error bars show SD. P indicates the statistical significance as measured by Student’s t test throughout.
Figure 4
Figure 4. mTOR is essential for senescence upon Pten loss.
(A) Western blot analysis of primary Ptenlx/lx MEFs after rapamycin treatment and acute inactivation of Pten with Ad-Cre (PtenΔ/Δ), according to the experimental scheme shown in Supplemental Figure 1E. Numbers indicate densitometrically determined protein levels relative to β-actin. Senescence-associated β-gal staining and its quantification is also shown. Scale bar: 10 μm. Error bars show SD. (B) Western analysis in Pten-deficient and Pten-mTOR compound mutant primary MEFs (by retroviral infection/selection). Numbers indicate densitometrically determined protein levels for p53 relative to β-actin. Senescence-associated β-gal staining and its quantification is also shown. Scale bar: 10 μm. Error bars show SD. (C) Western analysis of Pten–/–p19Arf–/– compound mutant MEFs (by retroviral infection/selection) and quantification of p53 levels. Error bars show SD of 3 independent experiments. (D) MEFs as in C, treated with rapamycin (rapa) or DMSO for 24 hours. Error bars show SD of 3 independent experiments. (E) Western blot analysis and quantification for Pten and p53 protein levels of MEFs infected as in A and treated with MG132 48 hours after infection. Error bars show SD of 3 independent experiments. (CE) Numbers within and above columns indicate the average p53 levels observed in independent experiments. (F) Senescence-associated β-gal staining and quantification of PtenΔ/Δ MEFs treated with rapamycin and/or Nutlin-3 during Ad-Cre–mediated PICS. Scale bar: 10 μm. Error bars show SD of 3 independent experiments. P indicates the statistical significance as measured by Student’s t test throughout.
Figure 5
Figure 5. Nutlin-3 potentiates senescence and acts synergistically to RAD001 in restricting tumorigenesis in vivo.
(A) Schematic representation of the timing of drug administration in the different treatment groups (n = 10 for each group). sac, sacrifice. (B) Sizes of the anterior prostate in Ptenpc–/– mice (8 weeks of age) after the indicated treatments. (C) Quantification of the anterior prostates (APs) size and number of PIN-affected glands in mice (n = 6 for each treatment group) treated with the indicated drugs. Error bars show SD. P indicates the statistical significance (untreated versus each group of treatments). (D) Histopathological analysis and senescence of 8-week-old prostate tumors after treatments and staining as indicated: H&E, pS6, β-gal, p53, and Ki-67. Insets in H&E, pS6, p53, and Ki-67 represent a WT control stained as indicated (original magnification, ×20). (E) Quantification of the β-gal staining in anterior prostate sections of mice treated as indicate Representative sections from 3 mice were counted for each treatment group. Sections were counterstained with DAPI staining for β-gal quantification. (F) Quantification of p53 in the anterior prostate sections of mice treated as indicated. Sections from 3 mice were counted for each treatment group. (G) Quantification of Ki-67 staining in anterior prostates of mice treated as indicated and quantified as in E. (H) Quantification of TUNEL assay for apoptosis in the anterior prostates of mice treated as indicated (more than 3 mice per treatment group). Error bars in EH represent SD for a representative experiment performed in triplicate. (I) Summary of the molecular pathway and pharmacological manipulation of PI3K pathway for pro-senescence therapy for cancer.

Comment in

Similar articles

Cited by

References

    1. Campisi J. Senescent cells, tumor suppression, and organismal aging: good citizens, bad neighbors. Cell. 2005;120(4):513–522. doi: 10.1016/j.cell.2005.02.003. - DOI - PubMed
    1. Braig M, et al. Oncogene-induced senescence as an initial barrier in lymphoma development. Nature. 2005;436(7051):660–665. doi: 10.1038/nature03841. - DOI - PubMed
    1. Chen Z, et al. Crucial role of p53-dependent cellular senescence in suppression of Pten-deficient tumorigenesis. Nature. 2005;436(7051):725–730. doi: 10.1038/nature03918. - DOI - PMC - PubMed
    1. Collado M, et al. Tumour biology: senescence in premalignant tumours. Nature. 2005;436(7051):642. doi: 10.1038/436642a. - DOI - PubMed
    1. Michaloglou C, et al. BRAFE600-associated senescence-like cell cycle arrest of human naevi. Nature. 2005;436(7051):720–724. doi: 10.1038/nature03890. - DOI - PubMed

Publication types

MeSH terms