. 2010 Mar;120(3):668-80.
doi: 10.1172/JCI36667. Epub 2010 Feb 8.

CD99 inhibits neural differentiation of human Ewing sarcoma cells and thereby contributes to oncogenesis

Affiliations

CD99 inhibits neural differentiation of human Ewing sarcoma cells and thereby contributes to oncogenesis

Anna Rocchi et al. J Clin Invest. 2010 Mar.

Abstract

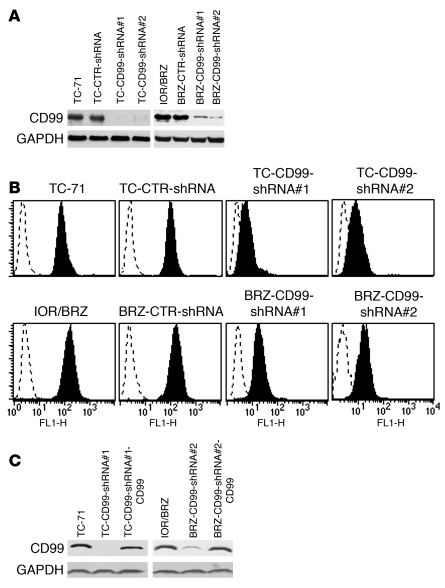
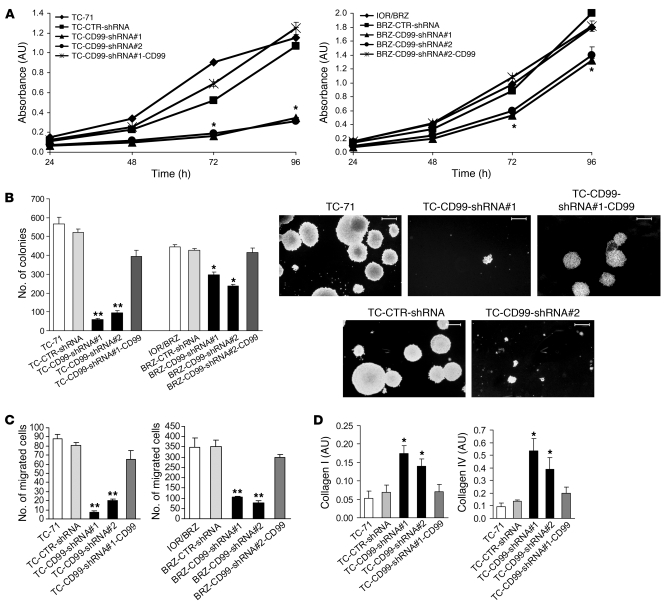
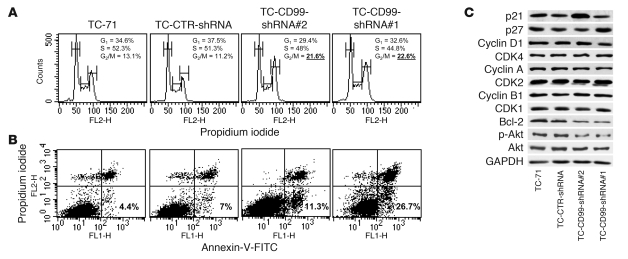
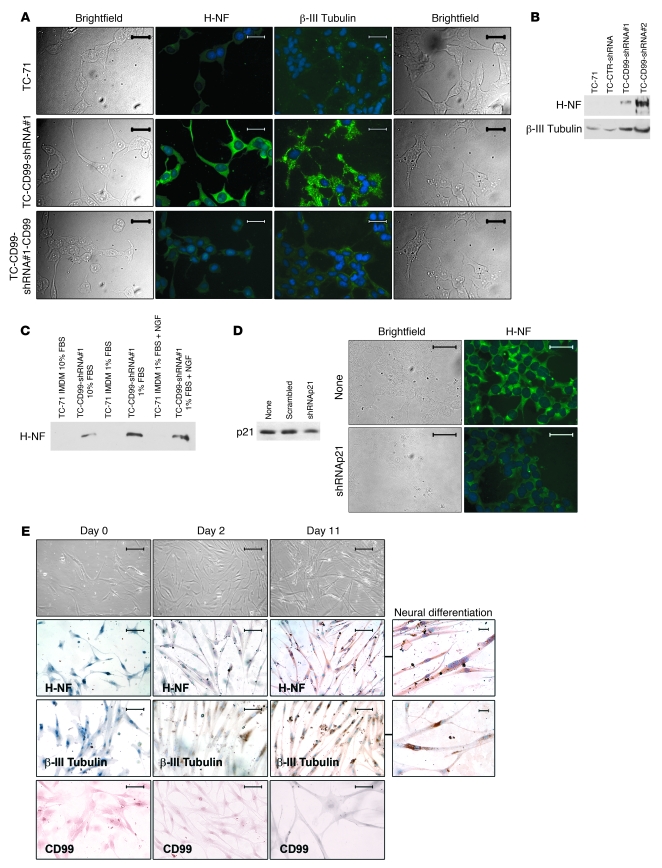
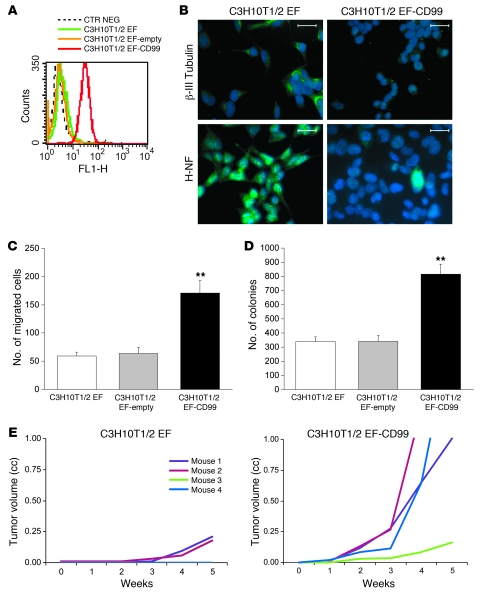
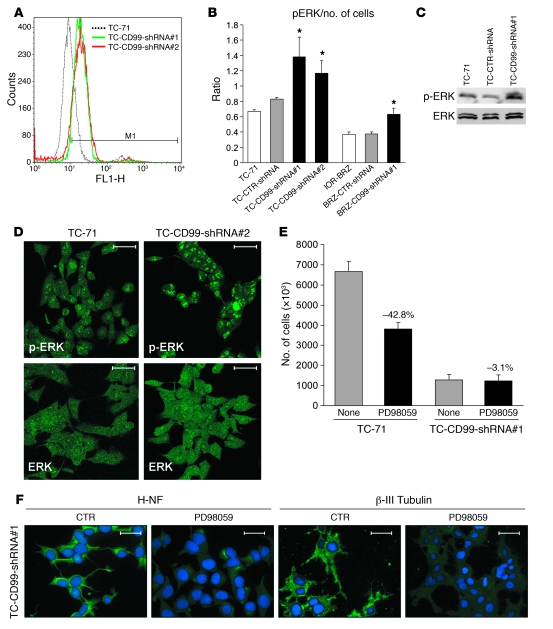
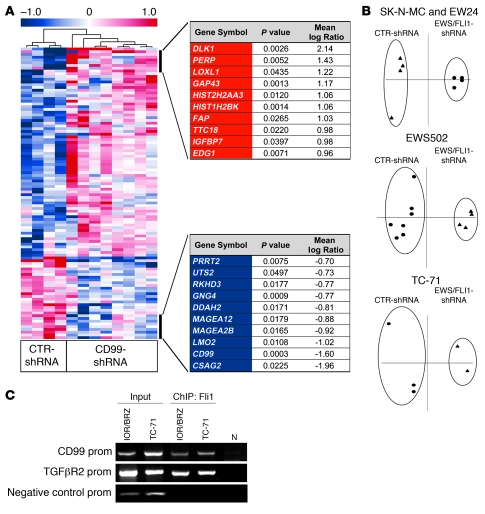
Ewing sarcoma (EWS) is an aggressive bone tumor of uncertain cellular origin. CD99 is a membrane protein that is expressed in most cases of EWS, although its function in the disease is unknown. Here we have shown that endogenous CD99 expression modulates EWS tumor differentiation and malignancy. We determined that knocking down CD99 expression in human EWS cell lines reduced their ability to form tumors and bone metastases when xenografted into immunodeficient mice and diminished their tumorigenic characteristics in vitro. Further, reduction of CD99 expression resulted in neurite outgrowth and increased expression of beta-III tubulin and markers of neural differentiation. Analysis of a panel of human EWS cells revealed an inverse correlation between CD99 and H-neurofilament expression, as well as an inverse correlation between neural differentiation and oncogenic transformation. As knockdown of CD99 also led to an increase in phosphorylation of ERK1/2, we suggest that the CD99-mediated prevention of neural differentiation of EWS occurs through MAPK pathway modulation. Together, these data indicate a new role for CD99 in preventing neural differentiation of EWS cells and suggest that blockade of CD99 or its downstream molecular pathway may be a new therapeutic approach for EWS.


Figures

Figure 1
Figure 1. Silencing of CD99 by shRNA plasmid.
(A) Stable transfection of TC-71 and IOR/BRZ cells with CD99-shRNA plasmid results in a substantial reduction in CD99 protein levels as determined by Western blotting. GAPDH is shown as loading control. (B) CD99 expression in derived TC-71 and IOR/BRZ clones by cytofluorometry. (C) Reexpression of CD99 in knockdown/rescue cells visualized by Western blotting. GAPDH is shown as loading control.
Figure 2
Figure 2. In vitro growth features of EWS cells silenced for CD99.
(A) CD99-silenced cells showed reduced growth in monolayer conditions compared with controls. Reexpression of CD99 rescued the growth inhibition caused by CD99 knockdown in TC-71 and IOR/BRZ cells. Data are presented as mean ± SEM of experiments performed in triplicate. Absorbance was measured at a wavelength of 550 nm. *P < 0.05, Student’s t test with respect to parental and CD99-reexpressing cells. (B) CD99-silenced cells showed reduced growth in anchorage-independent conditions. Reexpression of CD99 rescued the growth inhibition. Data are presented as mean ± SEM of experiments performed in triplicate. *P < 0.05, **P < 0.001, Student’s t test versus parental and CD99-reexpressing cells. Representative photomicrographs are shown for TC-71–derived cells. Digital images were taken under identical conditions at the same time. Scale bars: 600 μm. (C) Migratory ability of CD99-silenced cells was significantly reduced compared with that of controls. Reexpression of CD99 rescued the migration deficit caused by CD99 knockdown in TC-71 and IOR/BRZ cells. Data are presented as mean ± SEM of experiments performed in triplicate and indicate the number of cells that migrated 12 hours after cell seeding. **P < 0.001, Student’s t test versus parental and CD99-reexpressing cells. (D) Cell adhesion tests to extracellular matrix components demonstrate that CD99-deprived cells adhere faster to collagen I and IV. Data are presented as mean ± SEM of experiments performed in triplicate. *P < 0.05 versus parental and CD9-reexpressing cells, Student’s t test.
Figure 3
Figure 3. CD99 influences cell proliferation and apoptosis of EWS cells.
(A) Cell cycle analysis of TC-71–derived cells. Cells were stained with propidium iodide (a DNA stain) and DNA content analyzed by ModFit LT software. Data are from an experiment representative of 2 independent experiments. Percentages of cells in G2/M phase were significantly different in CD99-silenced cells compared with controls; P < 0.05, Student’s t test. (B) Detection of annexin V–FITC–labeled apoptotic cells by flow cytometric analysis in TC-71–derived cells. The simultaneous application of propidium iodide as a DNA stain allows the discrimination of necrotic cells (upper right) from the apoptotic cells positively stained for annexin V (lower right). Data are from an experiment representative of 2 independent experiments. Percentages of apoptotic cells (annexin V–positive and propidium iodide–negative) were significantly different in CD99-silenced cells compared with controls; P < 0.05, Student’s t test. (C) Western blot analysis of a series of cell cycle and apoptosis regulators. Induction of the cell cycle inhibitors p21 or p27 was observed together with repression of the antiapoptotic protein Bcl-2. The phosphorylation of Akt was also inhibited in CD99-silenced cells.
Figure 4
Figure 4. CD99 influences neural differentiation in EWS and human MSCs.
(A) H-NF and β-III tubulin expression in CD99-silenced cells that were maintained in standard culture conditions. Neural differentiation was reversed when CD99 was reexpressed in knockdown/rescue cells. Representative photomicrographs are shown for TC-71–derived cells. Scale bars: 120 μm. (B) Western blot analysis of H-NF and β-III tubulin expression in CD99-silenced cells that were maintained in standard culture conditions. Expression of H-NF was observed only in CD99-deprived cells, while β-III tubulin expression was induced. (C) Western blot analysis of H-NF TC-71 and TC-CD99-shRNA#1 cells after exposure to low-serum medium (1% IMDM) or NGF (20 ng/ml) for 72 hours. Again, expression of H-NF was observed only in CD99-silenced cells. (D) Downregulation of p21 in TC-CD99-shRNA#2 by transient silencing of the molecule, as detected by Western blotting, resulted in inhibition of the neural differentiation, as shown by H-NF expression. Cells were exposed to shRNA against p21 for 24 hours and then evaluated for H-NF expression. Representative photomicrographs are shown for TC-71–derived cells. Scale bars: 120 μm. (E) MSCs were cultured in neural differentiation medium, and terminal differentiation was monitored by H-NF and β-III tubulin staining that visualized neural development. The expression of CD99 is lost during neural development, as shown by avidin-biotin immunostaining. All digital images were taken under identical conditions, at the same time, and using the same image analysis software (Quips-XL genetic workstation). Scale bars: 600 μm; enlarged sections, 300 μm.
Figure 5
Figure 5. Analysis of CD99 activity in the absence of endogenous CD99 expression.
(A) Induction of CD99 expression in a murine model of EWS. The murine mesen­chymal multipotent C3H10T1/2 cell line was transfected with EWS/FLI1 (C3H10T1/2 EF) (53) and with CD99 (C3H10T1/2 EF-CD99). (B) CD99 expression repressed neural differentiation, as shown by β-III tubulin and H-NF immunostaining. Digital images were taken under identical conditions, at the same time and using the same image analysis software (Quips-XL genetic workstation). Scale bars: 120 μm. (C) Expression of CD99 in C3H10T1/2 EF increased cell migration. Data are presented as mean ± SEM of experiments performed in triplicate. **P < 0.001, Student’s t test. (D) Expression of CD99 in C3H10T1/2 EF increased colony formation in soft agar. Mean values and standard errors obtained for triplicate experiments are indicated. **P < 0.001, Student’s t test. (E) In vivo tumor growth of C3H10T1/2 EF compared with C3H10T1/2 EF cells expressing CD99. CD99 clearly enhances tumor growth rate.
Figure 6
Figure 6. Insights into the mechanisms of CD99-silenced cells.
(A) Increased expression of activated p-ERK in cells deprived of CD99 as shown by cytofluorometric analysis. (B) Cell-based ELISA evaluation of activated p-ERK. Once normalized to cell number, the phosphorylation level is directly related to the extent of activation. Cells deprived of CD99 showed a higher levels of p-ERK. Wavelength, 550 nm. Data are presented as mean ± SEM of experiments performed in triplicate; *P < 0.05 versus controls, Student’s t test. (C) Western blot analysis of ERK and p-ERK confirmed the higher levels of activation in CD99-silenced cells. (D) Confocal microscopy further confirmed higher expression of the activated ERK in CD99-silenced cells compared with controls. No remarkable differences were observed between parental and transfected cells versus total ERK. Scale bars: 120 μm. (E) Forty-eight hours of treatment of TC-71 and derived cells with the ERK inhibitor PD98059 (50 μM) resulted in growth inhibition of the parental cells but not of the CD99-silenced cells. Data are presented as mean ± SEM of experiments performed in triplicate. (F) H-NF and β-III tubulin staining of CD99-silenced cells after 48-hour treatment with the ERK inhibitor PD98059. ERK inactivation inhibited expression of H-NF in CD99-silenced cells. Nuclei are counterstained with bisbenzimide Hoechst 33258. Digital images were taken under identical conditions, at the same time, and using the same image analysis software (Quips-XL genetic workstation). Scale bars: 120 μm.
Figure 7
Figure 7. Relationship of CD99 expression and EWS/FLI expression.
(A) Hierarchical clustering of CD99-associated signature based on TC-71 and IOR/BRZ silenced cells. The signature included 106 genes: 76 upregulated and 30 downregulated (Supplemental Table 1; t test, P < 0.05). The top 10 CD99 up- (red) or downmodulated genes (blue) are shown. (B) We applied PCA using the CD99-associated signature (Supplemental Table 1) on EWS/FLI1-silenced EWS cells derived from SK-M-NC and EW24 (dataset from ref. 10) or from EWS502 and TC-71 cell lines (dataset from ref. 55). CD99 signature allowed for a clear separation of EWS/FLI knockdown cells from controls. Circles indicate EWS/FLI1 silenced cells; triangles indicate controls. (C) Interaction between EWS/FLI1 and CD99 promoter (prom). ChIP was carried out in TC71 and IOR/BRZ cells as described in Supplemental Methods by using anti-Fli1 antibody. The CD99 promoter region containing the ets sequence was detected by PCR with specific primers listed in Supplemental Methods. One microliter of initial preparations of soluble chromatin (Input) was amplified to control input DNA. In control samples (N), normal rabbit IgG was used instead of the primary Ab as control of Ab specificity. The occupancy of EWS/FLI1 on the TGFβR2 promoter was tested with specific primers as a control for ChIP reaction. The negative control promoter primers used for ChIP were previously described (72).

Similar articles

Cited by

References

    1. Bernstein M, et al. Ewing’s sarcoma family of tumors: current management. Oncologist. 2006;11(5):503–519. - PubMed
    1. Henderson DW, Leppard PJ, Brennan JS, Mukherjee TM, Swift JG. Primitive neuroepithelial tumours of soft tissues and of bone: further ultrastructural and immunocytochemical clarification of ‘Ewing’s sarcoma’, including freeze-fracture analysis. J Submicrosc Cytol Pathol. 1989;21(1):35–57. - PubMed
    1. Lipinski M, et al. Neuroectoderm-associated antigens on Ewing’s sarcoma cell lines. Cancer Res. 1987;47(1):183–187. - PubMed
    1. Lizard-Nacol S, Lizard G, Justrabo E, Turc-Carel C. Immunologic characterization of Ewing’s sarcoma using mesenchymal and neural markers. Am J Pathol. 1989;135(5):847–855. - PMC - PubMed
    1. Lizard-Nacol S, Volk C, Lizard G, Turc-Carel C. Abnormal expression of neurofilament proteins in Ewing’s sarcoma cell cultures. Tumour Biol. 1992;13(1–2):36–43. - PubMed

Publication types

MeSH terms