. 2010 Mar;120(3):907-23.
doi: 10.1172/JCI40645. Epub 2010 Feb 8.

Comprehensive assessment of chemokine expression profiles by flow cytometry

Affiliations

Comprehensive assessment of chemokine expression profiles by flow cytometry

Jens Eberlein et al. J Clin Invest. 2010 Mar.

Abstract

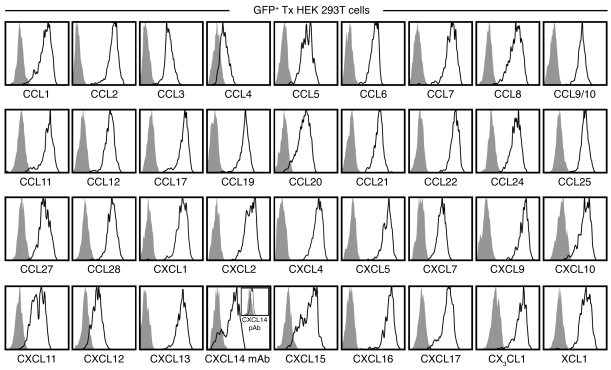
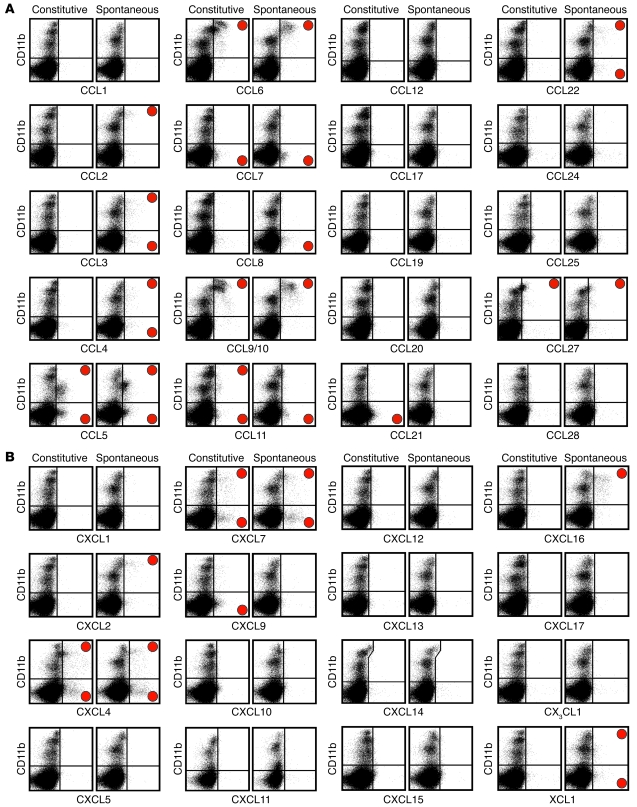
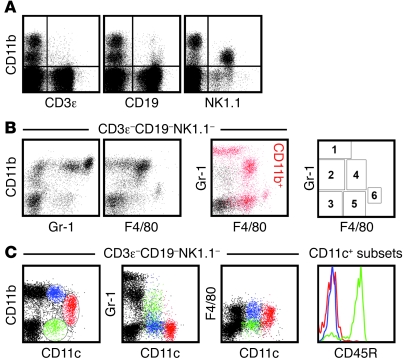
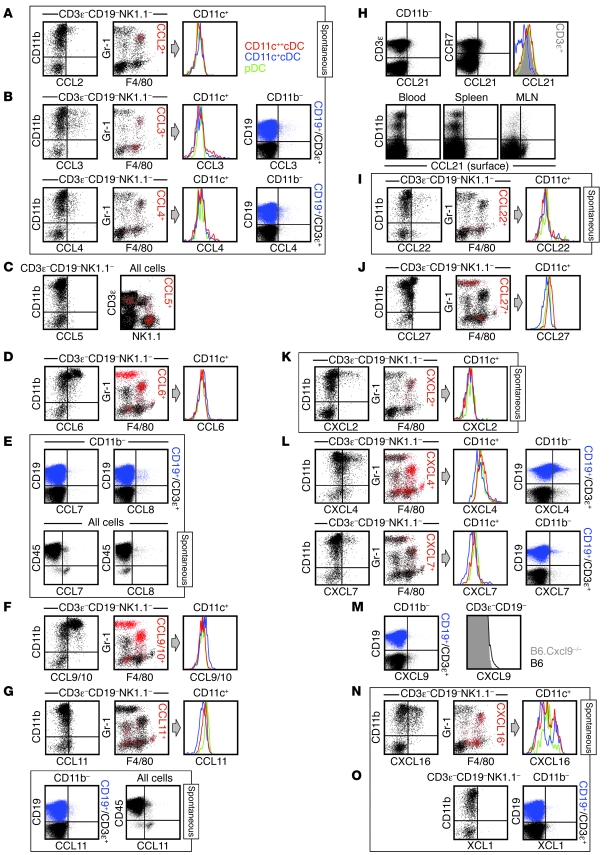
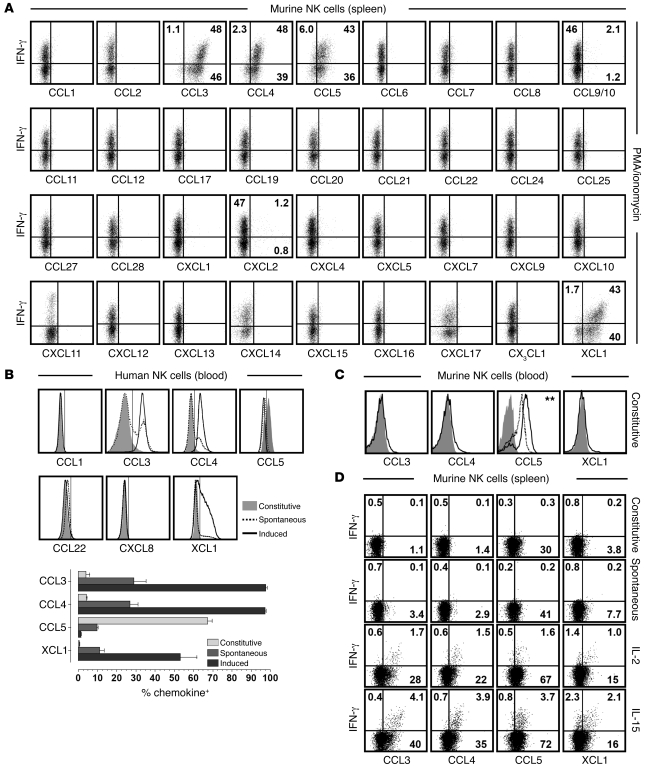
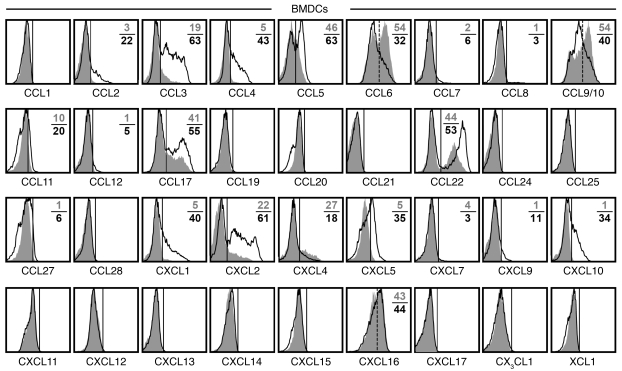
The chemokines are a large family of mainly secreted molecules involved in the regulation of numerous physiological and pathophysiological processes. Despite many years of investigation, the precise cellular sources of most chemokines have remained incompletely defined as a consequence of the limited availability of suitable reagents to visualize the expression of chemokine proteins at the single-cell level. Here, we developed a simple flow cytometry-based assay using commercially available chemokine-specific antibodies for efficient cell-associated detection of 37 of 39 murine chemokines. To demonstrate the utility of this methodology, we used it to reevaluate the nature of homeostatic chemokines in the hematopoietic compartment, to delineate the complete chemokine profiles of NK cells and B cells in response to major polyclonal stimuli, and to assess the chemokine response of DCs to bacterial infection. The versatility of this analytical methodology was further demonstrated by its application to selected human chemokines and should greatly facilitate any future investigation into chemokine biology at large.


Figures

Figure 1
Figure 1. Validation of chemokine-specific pAb use for FC.
HEK 293T cells were transfected (Tx) with individual pIRES2-AcGFP1 vectors containing Il15 (negative control) or 36 distinct murine chemokines and cultured for 18 hours. BFA was added for the final 14 hours to limit chemokine secretion, and cells were analyzed for expression of corresponding chemokine proteins by FC as detailed in Methods. All histograms are gated on GFP+ HEK cells comparing Il15 transfectants (gray solid) and respective chemokine transfectants (black tracing) stained with the same chemokine-specific pAb. To reduce proteasomal degradation, Cxcl14-transfected HEK cells were cultured in the presence of 10 μM of the protease inhibitor MG-132 and stained with anti-hCXCL14 mAb clone 131120 or with an anti-hCXCL14 pAb (inset).
Figure 2
Figure 2. Visualization and identification of homeostatic chemokines in splenic hematopoietic cells.
(A and B) Spleen cells obtained from naive B6 mice (or, for CXCL11 analyses, from Balb/c mice) were analyzed for chemokine expression directly ex vivo (constitutive) or after a 5-hour culture in the presence of BFA but absent any exogenous stimuli (spontaneous) as detailed in Methods. All plots are gated on “live” cells, as determined by forward/side scatter properties. Red circles denote chemokine-positive staining in the respective quadrants. (A) CC family. (B) CXC, CX3C, and C families. Note that our analyses of CXCL14 expression with a preconjugated anti-hCXCL14 mAb (clone 131120) were associated with nonspecific staining of a CD11b++ cell subset (identical staining pattern observed with a preconjugated mIgG2a isotype control; not shown). Data are compiled from multiple independent experiments (n = 2–3 mice), with individual chemokine stains repeated at least twice.
Figure 3
Figure 3. Phenotypic distinction of CD3εCD19NK1.1 cell populations.
Single-cell suspensions prepared from spleens of naive B6 mice were analyzed directly ex vivo for expression of various cell surface markers. (A) CD11b expression by small subsets of CD3ε+ T and CD19+ B cells as well as mature NK cells. (B) Analytical exclusion of T cells (CD3ε+), B cells (CD19+), NK cells (NK1.1+), and NKT cells (NK1.1+CD3ε+) permitted delineation of 6 cellular subsets according to expression of CD11b, Gr-1 (Ly6C/G), and F4/80 antigens. In the 2-color dot plot, CD11b-expressing cells are identified as red events. The plot at right demarcates regions corresponding to the 6 distinct cell subsets in the 2-color dot plot, whose identities are summarized in Table 3. (C) Major DC subsets were distinguished based on CD11b and CD11c expression patterns (left), with respective Gr-1, F4/80, and CD45R (B220) expression profiles shown at right, distinguished by color.
Figure 4
Figure 4. Delineation of cellular subsets expressing homeostatic chemokines.
Spleen cells obtained from naive mice were analyzed directly ex vivo (constitutive) or after 5 hours of in vitro culture in the presence of BFA (spontaneous; identified by labeled boxes). For chemokines preferentially expressed by CD11b+ cell subsets (A, B, D, F, G, IL, and N), dot plots are gated on CD3εCD19NK1.1 as indicated. In the 2-color black/red dot plots, chemokine-expressing cells are identified as red events; histograms are gated on CD11c-expressing cells and color-coded as in A. For chemokines expressed by CD11b cells (B, E, G, and LN), 2-color dot plots are gated on B cells (CD19+CD3εCD11b, blue) and T cells (CD19CD3ε+CD11b, black). (C, E, G, H, and M) Note the partially different gating strategies used for analysis of CCL5/7/8/11/21 and CXCL9 expression. (C) Constitutive CCL5 was not detectable in CD3εCD19NK1.1 cells (left), but was detected in NK cells, subpopulations of T cells, and some NKT cells (right). (E and G) Spontaneous CCL7/11, but not CCL8, production in cell subsets lacking CD45 expression. (H) Top: Ex vivo detectable CCL21 expression by T cells (left) and CCR7+ cells (middle). Histogram at right is gated on the 3 DC subsets (colored traces) and CD3ε+T cells (gray solid). Bottom: CCL21 surface stains of cells recovered from blood, spleen, and mesenteric lymph node (MLN). (M) Constitutive CXCL9 expression by T cells (histograms gated on CD3ε+T cells from Cxcl9–/– and B6 mice). Experiments were conducted in multiple independent experiments with groups of 3 mice and performed at least twice.
Figure 5
Figure 5. Chemokine profiles of murine and human NK cells.
(A) Splenocytes obtained from B6 mice (or Balb/c mice for CXCL11 analyses) were cultured for 5 hours with PMA/ionomycin and BFA and processed for chemokine FC. Plots are gated on NK1.1+CD3ε (B6) or DX5+CD3ε (Balb/c) cells; numbers within plots indicate mean percent IFN-γ+ and/or chemokine-positive cells in the respective quadrants. (B) Chemokine expression by human NK cells (CD56+CD3) was determined directly ex vivo (constitutive), after 5 hours of culture in the presence of BFA (spontaneous) or stimulation with PMA/ionomycin plus BFA (induced). Vertical markers were set according to goat IgG or isotype control stains. The fraction of chemokine+ NK cells obtained from 4 healthy volunteers is shown below (representative data from 3–5 independent experiments). (C) Blood-borne murine NK cells (NK1.1+CD3ε) were analyzed for constitutive chemokine expression (black tracings). Different controls (gray solid) are featured in the individual plots (CCL3 control, CCL3 stains of Ccl3–/– NK cells; CCL4 and XCL1 controls, goat IgG stains; CCL5 controls, CCL5 stains of Ccl5–/– and Ccl5+/– NK cells, the latter shown by dotted tracing). The CCL5 expression level (GMFI) of Ccl5+/– NK cells were slightly, but significantly, lower than those of wild-type NK cells (P = 0.01). (D) Constitutive, spontaneous, and cytokine-induced (100 ng/ml IL-2 or IL-15) CCL3/4/5 and XCL1 expression by splenic NK cells was determined in conjunction with IFN-γ; numbers denote average percentages of IFN-γ+ and/or chemokine-positive cells in corresponding quadrants. All data obtained for murine NK cells are representative for multiple independent experiments in 2–3 mice each.
Figure 6
Figure 6. DC chemokine response to bacterial infection.
BMDCs were obtained from B6 mice (or Balb/c mice for CXCL11 analyses), propagated by culture in GM-CSF, and infected with rLM-OVA at MOI 1 as described in Methods. At 4 hours after L. monocytogenes or mock infection, BFA was added to cultures for an additional 5 hours, followed by quantitation of chemokine expression by uninfected versus infected DCs. Histograms are gated on CD11c+ BMDCs and display chemokine expression by uninfected (gray solid) and infected (black tracing) cells. Solid vertical markers demarcate chemokine-expressing from nonexpressing cells, dashed markers for CCL6, CCL9/10, and CXCL16 distinguish chemokine++ and chemokine+/– cells. Numbers indicate the percentage of chemokine-positive DCs in the absence (gray) or presence (black) of infection; values are the average of duplicate experimental samples. Data are representative for 1 of 4 similar experiments. Similar results were obtained after 24 hours of rLM-OVA infection and prevention of cell death by addition of antibiotics after initial establishment of infection (not shown).

Similar articles

Cited by

References

    1. Rot A, von Andrian UH. Chemokines in innate and adaptive host defense: basic chemokinese grammar for immune cells. Annu Rev Immunol. 2004;22:891–928. doi: 10.1146/annurev.immunol.22.012703.104543. - DOI - PubMed
    1. Rossi D, Zlotnik A. The biology of chemokines and their receptors. Annu Rev Immunol. 2000;18:217–242. doi: 10.1146/annurev.immunol.18.1.217. - DOI - PubMed
    1. Kunkel EJ, Butcher EC. Chemokines and the tissue-specific migration of lymphocytes. Immunity. 2002;16(1):1–4. doi: 10.1016/S1074-7613(01)00261-8. - DOI - PubMed
    1. Cyster JG. Chemokines, sphingosine-1-phosphate, and cell migration in secondary lymphoid organs. Annu Rev Immunol. 2005;23:127–159. doi: 10.1146/annurev.immunol.23.021704.115628. - DOI - PubMed
    1. Cyster JG. Chemokines and cell migration in secondary lymphoid organs. Science. 1999;286(5447):2098–2102. doi: 10.1126/science.286.5447.2098. - DOI - PubMed

Publication types

MeSH terms