. 2010 Mar 3:8:17.
doi: 10.1186/1741-7007-8-17.

Identification and characterization of Dlc1 isoforms in the mouse and study of the biological function of a single gene trapped isoform

Affiliations

Identification and characterization of Dlc1 isoforms in the mouse and study of the biological function of a single gene trapped isoform

Mohammad G Sabbir et al. BMC Biol. .

Abstract

Background: The Dlc1 (deleted in liver cancer 1) tumour suppressor gene codes for a RhoGTPase activating protein that is found inactivated in many tumour types. Several transcriptional isoforms have been described but the functional significance and tissue distribution of each form is presently poorly understood. Also, differences in the number of isoforms and splice variants reported still exist between different mammalian species. In order to better understand the number and function of the different variants of the Dlc1 gene in the mouse, we have carried out a detailed analysis. Extensive 3' RACE experiments were carried out in order to identify all possible Dlc1 isoforms and splice variants in the mouse. In addition, we have generated a gene trapped mouse that targets one of these isoforms in order to study its biological function. The effect of this gene trap insertion on the splicing of other isoforms has also been studied.

Results: In addition to the known 6.1 and 6.2 Kb transcripts of Dlc1, our study revealed the existence of a novel 7.6 Kb transcriptional isoform in the mouse, which corresponds to the human 7.4 Kb (KIAA1723) cDNA transcript. A gene trapped embryonic cell line, with an insertion between Exon 1 and 2 of the 6.1 Kb transcriptional isoform, was used to generate a transgenic mouse. This line showed a significant reduction in the expression of the trapped isoform. However, reduced expression of the other isoforms was not seen. Mice heterozygous for the gene trapped allele were phenotypically normal, but homozygous mutant embryos did not survive beyond 10.5 days post coitum. Dlc1gt/gt embryos showed defects in the brain, heart, and placental blood vessels. Cultured serum-free mouse embryo cells from Dlc1 deficient embryos had elevated RhoA activity and displayed alterations in the organization of actin filaments and focal adhesions. The Dlc1 deficient cells also exhibited increased wound closure in an in vitro scratch assay.

Conclusions: The mouse has three major transcriptional isoforms of the Dlc1 gene that are differentially expressed in various tissues. A mouse with exon 1 of the 6.1 Kb transcript gt resulted in hypomorphic expression of Dlc1 protein and an embryonic lethal phenotype in the homozygous condition, which indicates that this isoform plays a major role in mouse development. The Dlc1 deficient cells showed altered cytoskeleton structure, increased RhoA activity and cellular migration.


Figures

Figure 1
Figure 1
Splicing pattern of the transcriptional isoforms of Dlc1 gene. (A) Genomic organization of Dlc1 gene. Solid black rectangles represent exons of the Dlc1 gene; green rectangles represent exons of the unknown gene (A730069N07Rik). (B) Blast alignment of the 3'RACE sequences indicating the presence of 7.6 Kb and 2.1 Kb transcriptional isoforms in the UCSC genome database. (C) Predicted isoforms and splice variants of the Dlc1 gene based on the 3'RACE sequences and cDNAs in the databases. The exonic units are represented by solid rectangles separated by blank space which indicates an intron.
Figure 2
Figure 2
Northern blot of ribonucleic acid (RNA) from different mouse tissues. Poly(A)+ RNA from different mouse tissues were transferred to a nylon membrane and hybridized sequentially with a 3.3 Kb deleted in liver cancer 1 RNA probe and a mouse GAPDH probe.
Figure 3
Figure 3
Absolute quantification of Dlc1 transcriptional isoforms in mouse tissues by real time reverse transcription polymerase chain reaction (PCR). (A) Representative melt curve analysis plot of the PCR amplified product specific to Dlc1 isoforms and GAPDH. (B) Copies of Dlc1 6.1, 6.2, and 7.6 Kb transcriptional isoforms per 1000 copies of GAPDH (absolute copy number of cDNA). The mean and standard deviation was determined from triplicate experiments.
Figure 4
Figure 4
Dlc1 protein expression in different mouse tissues. Western blots of total cellular protein extracted from different mouse tissues using Dlc1 polyclonal antibody. The upper blot shows expression of Dlc1 related proteins and the lower blot shows the GAPDH loading control.
Figure 5
Figure 5
Methylation status of the Dlc1 alternative isoform promoters in different mouse tissues. (A) The Dlc1 6.1 and 6.2 isoform promoter sequences showing the location of the polymerase chain reaction primers (underlined), sequencing primer (bold and italics) and the CpG islands (numbered) that were analysed. (B) The reference peak heights for the 6.1 (left) and 6.2 Kb (right) isoform promoter sequences. (C) Pyrograms for liver DNA, showing the 6.1 Kb isoform promoter (left) and the 6.2 Kb isoform promoter (right). (D) The mean percentage of methylation for the different CpG islands in the mouse tissues examined, 6.1 Kb promoter (left), 6.2 Kb promoter (right).
Figure 6
Figure 6
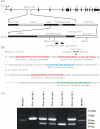
Genotyping of the Dlc1 gene trapped mouse. (A)-(i) Diagrammatic representation of the Dlc1 locus showing the insertion site of the gene trap vector pGT1Lxf; (ii) the gene map of the integrated vector. (B) Sequence of the gene trap vector insertion site with the intronic junction fragment. The polymerase chain reaction (PCR) primers sequences used to genotype the gene trap mutant mouse are highlighted. (C) Multiplex PCR showing homozygous, heterozygous and wild type bands in 10.5 dpc Dlc1 embryos.
Figure 7
Figure 7
Multiplex reverse transcriptase polymerase chain reaction (RT-PCR) showing the effect of gene trap insertion on the various Dlc1 isoforms. (A) Diagrammatic representation of the Dlc1 gene showing the position of different PCR primers sets used; (i) to show relative expression of GAPDH mRNA and Dlc1 isoforms and (ii) to show the relative expression of gene trap fusion transcripts and Dlc1 normal transcripts. (B) Multiplex RT-PCR showing the expression of 7.6 Kb, 6.2 Kb and 6.1 Kb Dlc1 isoforms and alternative splice forms relative to GAPDH expression (C) Multiplex RT-PCR showing the expression of 7.6 Kb, 6.2 Kb and 6.1 Kb Dlc1 isoform normal transcripts relative to their fusion splice products with βgeo of the gene trap vector.
Figure 8
Figure 8
Quantitative real-time reverse transcriptase polymerase chain reaction (RT-PCR) analysis of the absolute copy number of Dlc1 isoforms in Dlc1 deficient serum-free mouse embryo cell lines. The mean and standard deviation was determined from triplicate experiments. The upper panel of the diagram shows the position of the RT-PCR primers used for amplification of the specific isoforms. *P < 0.001, by one way ANOVA test.
Figure 9
Figure 9
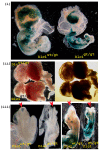
Dlc1gt/gt embryos. (i) X-gal stained Dlc1wt/gt and Dlc1gt/gt embryos and placenta showing expression of Dlc1 exon1-βgeo fusion protein. (ii) Impairment of yolk sac blood vessel formation in Dlc1gt/gt mouse embryos. The yolk sacs of 10.5 dpc Dlc1wt/gt and Dlc1gt/gt mouse embryos with the later, showing no detectable blood vessels. (iii) The Dlc1gt/gt embryos showing failure to close the neural tube at the anterior part of the body (left: unstained embryos and right: X-gal stained embryos).
Figure 10
Figure 10
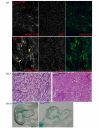
Placental and heart abnormalities in Dlc1gt/gt embryos. (i) Immunofluorescent staining of the placenta of 10.5 days post coitum (dpc) Dlc1wt/wt and Dlc1gt/gt embryos with PECAM (CD31) antibody. Twelve micrometer thick frozen paraformaldehyde fixed placental sections were incubated with anti-PECAM-1 antibody and then with FITC conjugated secondary antibody. (ii) The yellow arrow indicates a continuous network of blood vessel in the placental labyrinth haematoxylin and eosin stained sections of placental labyrinth of 10.5 dpc Dlc1wt/gt and Dlc1gt/gt embryos. Black asterisks indicate fetal erythrocytes and the yellow asterisk indicates maternal red blood cells. (iii) Transverse section of the X-gal stained heart of 10.5 dpc Dlc1wt/gt and Dlcgt/gt embryos. The yellow asterisk indicates normal thick trabeculated ventricular wall; the red asterisk thin smooth atria wall; and the green asterisk with foetal erythrocytes.
Figure 11
Figure 11
Dlc1 and p21WAF1 protein expression in Dlc1wt/wt, Dlc1wt/gt, and Dlc1gt/gt SFME cell lines. Western blots of total cellular protein extracted from different serum-free mouse embryo (SFME) cell lines. (A) Upper blot shows the expression of Dlc1 protein and lower blot shows actin expression. (B) Upper blot shows the expression of p21WAF1 protein and the lower blot shows actin expression. (C) Plot showing the relative intensity of Dlc1 123 KDa protein and p21WAF1 protein in SEME cell lines. Means and standard error of mean determined from at least six independent experiments using cell lines derived from different mouse embryos are given. * P < 0.001, by one way ANOVA test.
Figure 12
Figure 12
RhoGTP pull down assay and in situ RhoGTP affinity assay. RhoGTP pull down assay showing (A) constitutive and (B) LPA induced and control levels of active RhoGTP in Dlc1wt/wt, Dlc1wt/gt and Dlc1gt/gt SFME cell lines. (C) Dlc1 SFME cells exponentially growing on glass slides were fixed and cells were incubated with 50 μg/mL of soluble GST (i) or GST-RBD (ii). RhoGTP-bound RBD was detected by GST immunostaining. (D) Plot showing the RhoGTP to total Rho protein by scanning the relative intensity of the protein bands in non-treated and LPA induced in SEME cell lines. Means and standard error of mean determined from at least six independent experiments using cell lines derived from different mouse embryos are given. *P < 0.001, by two way ANOVA test.
Figure 13
Figure 13
Altered cytoskeletal organization in Dlc1 gene trapped and normal serum-free mouse embryo (SFME) cell lines. (A) SFME cell lines were stained with phalloidin-TRITC and DAPI. (B) Localization of vinculin in SFME cell lines by immunofluoresence. Cells were also stained with DAPI. (C) Cells were analysed to determine total cell area and the numbers of focal adhesions and stress fibres present as outlined in materials and methods. Means and standard error of mean determined from at least six independent experiments are given. *P < 0.001, by one way ANOVA test.
Figure 14
Figure 14
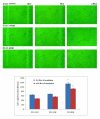
Scratch assay of Dlc1 gene trapped and normal mouse embryonic fibroblast cell lines at various time points. (A) The homozygous Dlc1gt/gt cells show increased wound closure by 18 h compared with the Dlc1wt/wt and Dlc1wt/gt cell lines. (B) Scratch assays at different time points. The plots show the changes in wounded surface area after 6 h [Blue] and 18 h [Red] after the wound creation. Mean ± standard error of mean of three independent experiments for each cell type and eight areas imaged for each experiment, *P < 0.001, by one way ANOVA test.

Similar articles

Cited by

References

    1. Ellenbroek SI, Collard JG. Rho GTPases: functions and association with cancer. Clin Exp Metastasis. 2007;24:657–672. doi: 10.1007/s10585-007-9119-1. - DOI - PubMed
    1. Moon SY, Zheng Y. Rho GTPase-activating proteins in cell regulation. Trends Cell Biol. 2003;13:13–22. doi: 10.1016/S0962-8924(02)00004-1. - DOI - PubMed
    1. Sahai E, Olson MF, Marshall CJ. Cross-talk between Ras and Rho signalling pathways in transformation favours proliferation and increased motility. EMBO J. 2001;20:755–766. doi: 10.1093/emboj/20.4.755. - DOI - PMC - PubMed
    1. Zohn IM, Campbell SL, Khosravi-Far R, Rossman KL, Der CJ. Rho family proteins and Ras transformation: the RHOad less traveled gets congested. Oncogene. 1998;17:1415–1438. doi: 10.1038/sj.onc.1202181. - DOI - PubMed
    1. Jaffe AB, Hall A. Rho GTPases: biochemistry and biology. Annu Rev Cell Dev Biol. 2005;21:247–269. doi: 10.1146/annurev.cellbio.21.020604.150721. - DOI - PubMed

Publication types

MeSH terms

Substances