. 2010 Mar 3:10:41.
doi: 10.1186/1471-2229-10-41.

Complementary genetic and genomic approaches help characterize the linkage group I seed protein QTL in soybean

Affiliations

Complementary genetic and genomic approaches help characterize the linkage group I seed protein QTL in soybean

Yung-Tsi Bolon et al. BMC Plant Biol. .

Abstract

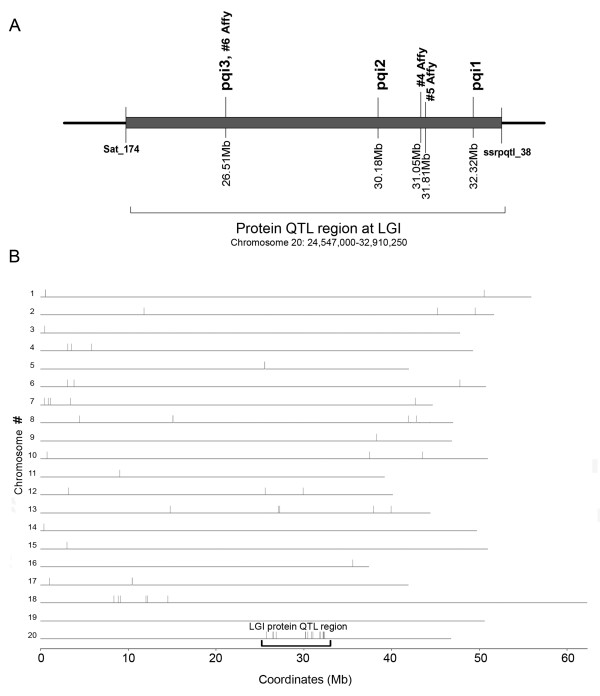
Background: The nutritional and economic value of many crops is effectively a function of seed protein and oil content. Insight into the genetic and molecular control mechanisms involved in the deposition of these constituents in the developing seed is needed to guide crop improvement. A quantitative trait locus (QTL) on Linkage Group I (LG I) of soybean (Glycine max (L.) Merrill) has a striking effect on seed protein content.

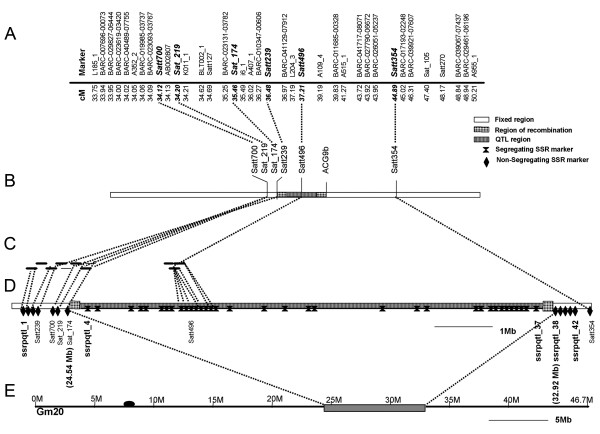
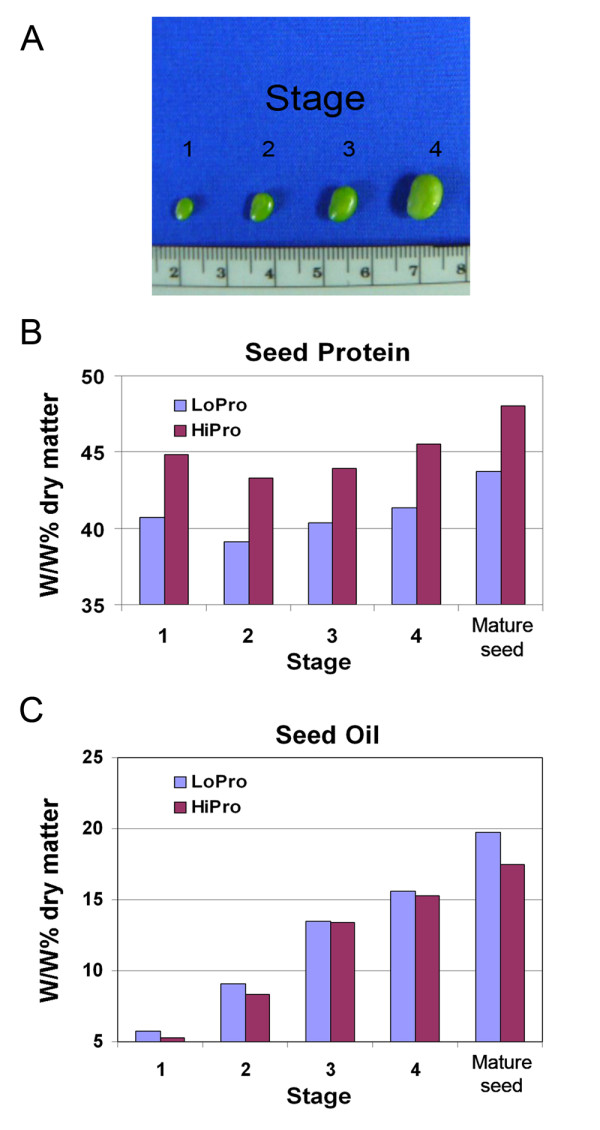
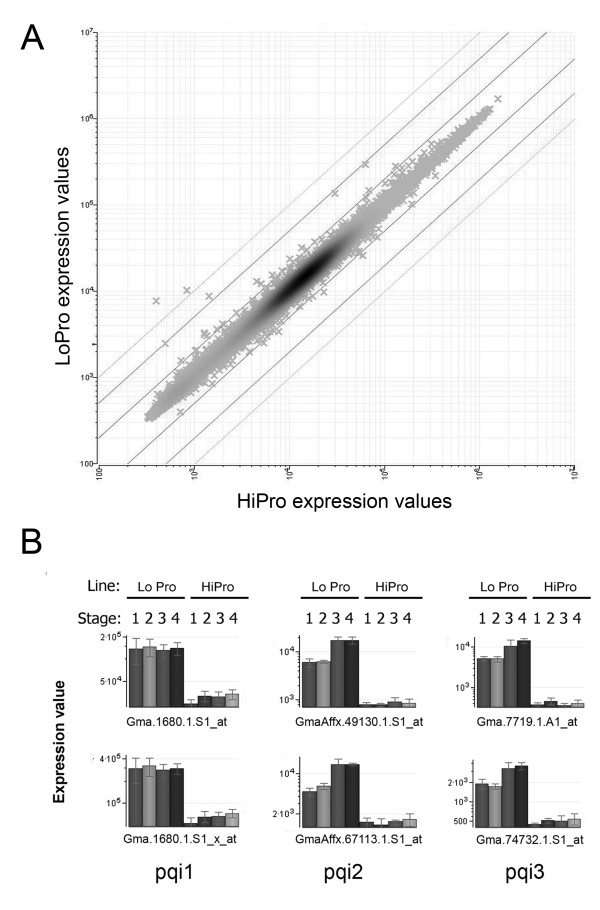
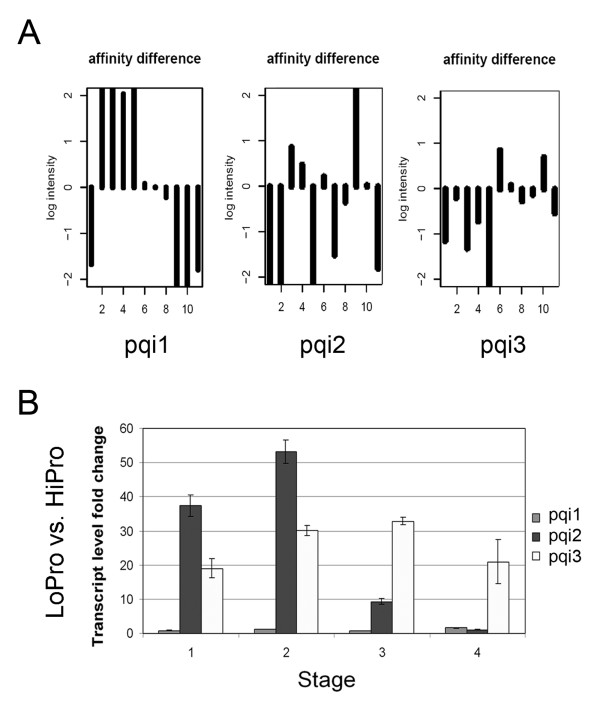
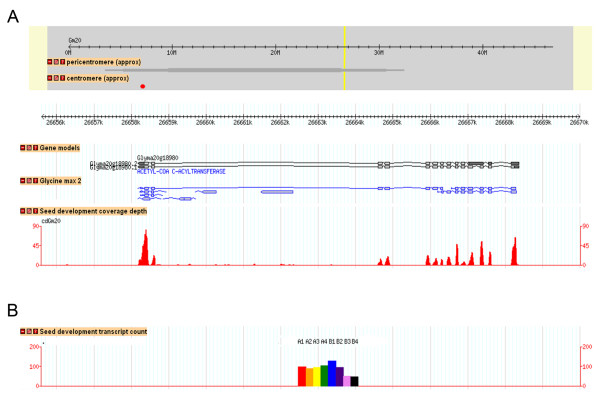
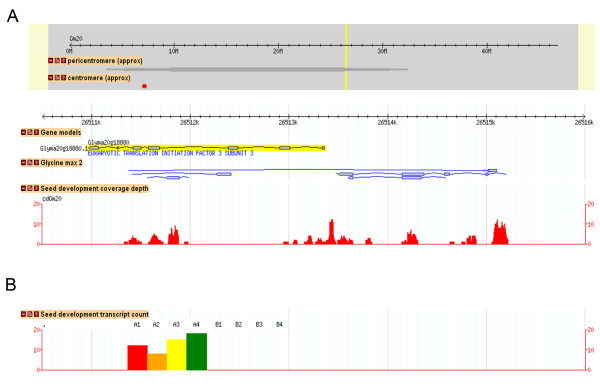
Results: A soybean near-isogenic line (NIL) pair contrasting in seed protein and differing in an introgressed genomic segment containing the LG I protein QTL was used as a resource to demarcate the QTL region and to study variation in transcript abundance in developing seed. The LG I QTL region was delineated to less than 8.4 Mbp of genomic sequence on chromosome 20. Using Affymetrix Soy GeneChip and high-throughput Illumina whole transcriptome sequencing platforms, 13 genes displaying significant seed transcript accumulation differences between NILs were identified that mapped to the 8.4 Mbp LG I protein QTL region.

Conclusions: This study identifies gene candidates at the LG I protein QTL for potential involvement in the regulation of protein content in the soybean seed. The results demonstrate the power of complementary approaches to characterize contrasting NILs and provide genome-wide transcriptome insight towards understanding seed biology and the soybean genome.


Figures

Figure 1
Figure 1
Demarcation of the LG I QTL region. (A) The genetic map of LG I [47] shows the markers that mapped close to the QTL region. (B) The fine map of the QTL [32] shows the QTL position in the segregating region between SSR marker Satt239 and AFLP marker ACG9b. (C) The physical map of the QTL region shows where the BACs were anchored to the SSR markers (Satt239, Satt700, Sat_174, Sat_219, and Satt496). BACs shown as bold lines were sequenced. BACs shown as thin lines were not sequenced; only BAC end sequences were generated. (D) Demarcation of the QTL region on chromosome 20 (Gm20) using additional SSR markers. The new SSR markers were named ssrpqtl_1 through ssrpqtl_42 (in bold) according to ascending position on chromosome 20 (see also Additional file 1: Table S1). The position of the LG I protein QTL region is demarcated between 24.54 Mb (Sat_174) and 32.92 Mb (ssrpqtl_38). (E) The QTL region highlighted on Chromosome 20. The dark oval represents the position of the centromere.
Figure 2
Figure 2
Phenotypic evaluation of NILs. (A) Different stages of the developing soybean seed are shown. Stages one to four correspond to the seed fill stages that were harvested for phenotypic evaluation and concurrently used for gene expression profiling in this study. Stage 1 = 25 to 50 mg seed. Stage 2 = >50 to 100 mg seed. Stage 3 = >100 to 200 mg seed. Stage 4 = >200 to 300 mg seed. Shown in the diagram are 25 mg, 50 mg, 100 mg, and 200 mg seed sizes. (B) Crude protein profiles graphed on a w/w% dry matter basis for the different stages of developing seed (stages one to four) and the final mature soybean seed. Protein profiles are graphed for both the low protein line (LoPro) and the high protein line (HiPro). (C) Crude oil profiles graphed on a w/w% dry matter basis for the different stages of developing seed (stages one to four) and the final mature soybean seed.
Figure 3
Figure 3
Differentially accumulated transcripts between NILs detected by microarray. (A) Log-log scatter plot of probeset expression values (x) from Student's t-test evaluation of combined stages from LoPro vs. HiPro highlighted six probesets with greater than four-fold change expression values. Diagonal lines represent two-fold, five-fold, and ten-fold change borders in either direction. (B) Expression values for the six probesets from (A) are graphed as a function of stage within each genotype. Standard error bars are shown for the three replicates. The six probesets correspond to a total of three genes (pqi1, pqi2, pqi3) represented by two Affymetrix® probesets each. Probesets Gma.1680.1.S1_at and Gma.1680.1.S1_x_at represent pqi1, probesets GmaAffx.49130.1.S1_at and GmaAffx.67113.1.S1_at represent pqi2, and probesets Gma.7719.1.A1_at and Gma.74732.1.S1_at represent pqi3.
Figure 4
Figure 4
Evaluation of differentially accumulated transcripts between NILs detected by microarray. (A) Single feature polymorphism (SFP) evaluation of the probesets for the three genes selected from Figure 3. Plots show the log intensity of the affinity difference between LoPro and HiPro for each probe of the representative 11-member probeset for each gene. (B) Quantitative real-time reverse transcriptase-polymerase chain reaction (qRT-PCR) was performed in triplicate for each of the three genes. Transcript level fold changes were compared between LoPro and HiPro lines with reference to an actin control.
Figure 5
Figure 5
Location of genes with differentially accumulating transcripts at the LG I protein QTL region in the soybean genome. (A) Genes with differentially accumulated transcripts identified by Affymetrix® Soy GeneChip at the LG I protein QTL region. (B) The locations of differentially accumulated transcripts found by N-way ANOVA mapped onto the 20 soybean chromosomes. A high-density cluster of transcripts was found at the LG I protein QTL region on chromosome 20.
Figure 6
Figure 6
Soybase Gbrowse HTTS seed development transcript coverage for Glyma20 g18980. Two different GBrowse annotation tracks displayed at http://soybase.org/gbrowse provide information on coverage depth and location of mapped read counts in relation to the soybean genome sequence. (A) Depicted here is a ~14 kb region from chromosome 20 showing the Glyma20 g18980 gene model "acetyl-CoA c-acyltransferase". Regions with TIGR TA EST data are shown under the "Glycine max 2" track. The "seed development coverage depth" track shows locations and counts of uniquely mapped HTTS reads. The coverage depth track shows the extent of redundancy in coverage at any nucleotide location. (B) The "seed development transcript count" track shows a colored histogram of relative expression counts in each of the eight libraries in this study: A1 to A4 correspond to LoPro stages one to four, and B1 to B4 correspond to HiPro stages one to four. Histograms for each gene are centered under their corresponding gene model.
Figure 7
Figure 7
Soybase Gbrowse HTTS seed development transcript coverage for Glyma20 g18880. Two different GBrowse annotation tracks displayed at http://soybase.org/gbrowse provide information on coverage depth and location of mapped read counts in relation to the soybean genome sequence. (A) Depicted here is a ~5 kb region from chromosome 20 showing the Glyma20 g18880 gene model annotated here as "eukaryotic translation initiation factor 3 subunit 3". Regions with TIGR TA EST data are shown under the "Glycine max 2" track. The "seed development coverage depth" track shows locations and counts of uniquely mapped HTTS reads. The coverage depth track shows the extent of redundancy in coverage at any nucleotide location. (B) The "seed development transcript count" track shows a colored histogram of relative expression counts in each of the eight libraries in this study: A1 to A4 correspond to LoPro stages one to four, and B1 to B4 correspond to HiPro stages one to four. Histograms for each gene are centered under their corresponding gene model. This gene region (pqi2) shows expression for only four of the eight libraries (values for A1 to A4 only; red, orange, yellow, green).

Similar articles

Cited by

References

    1. Hobbs DH, Flintham JE, Hills MJ. Genetic control of storage oil synthesis in seeds of Arabidopsis. Plant Physiol. 2004;136(2):3341–3349. doi: 10.1104/pp.104.049486. - DOI - PMC - PubMed
    1. Weber H, Borisjuk L, Wobus U. Molecular physiology of legume seed development. Annu Rev Plant Biol. 2005;56:253–279. doi: 10.1146/annurev.arplant.56.032604.144201. - DOI - PubMed
    1. Hajduch M, Ganapathy A, Stein JW, Thelen JJ. A systematic proteomic study of seed filling in soybean. Establishment of high-resolution two-dimensional reference maps, expression profiles, and an interactive proteome database. Plant Physiol. 2005;137(4):1397–1419. doi: 10.1104/pp.104.056614. - DOI - PMC - PubMed
    1. Gallardo K, Firnhaber C, Zuber H, Hericher D, Belghazi M, Henry C, Kuster H, Thompson R. A combined proteome and transcriptome analysis of developing Medicago truncatula seeds: evidence for metabolic specialization of maternal and filial tissues. Mol Cell Proteomics. 2007;6(12):2165–2179. doi: 10.1074/mcp.M700171-MCP200. - DOI - PubMed
    1. Jukanti AK, Heidlebaugh NM, Parrott DL, Fisher IA, McInnerney K, Fischer AM. Comparative transcriptome profiling of near-isogenic barley (Hordeum vulgare) lines differing in the allelic state of a major grain protein content locus identifies genes with possible roles in leaf senescence and nitrogen reallocation. New Phytol. 2008;177:333–349. - PubMed

Publication types