

Mapping interacting QTL for count phenotypes using hierarchical Poisson and binomial models: an application to reproductive traits in mice
- PMID: 20199696
- PMCID: PMC2938180
- DOI: 10.1017/S0016672310000029
Mapping interacting QTL for count phenotypes using hierarchical Poisson and binomial models: an application to reproductive traits in mice
Abstract
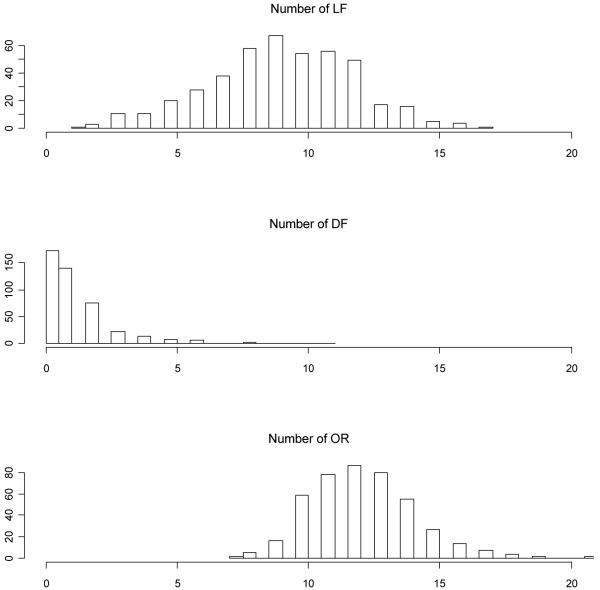
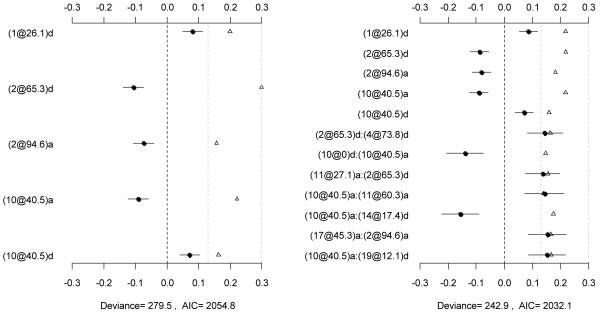
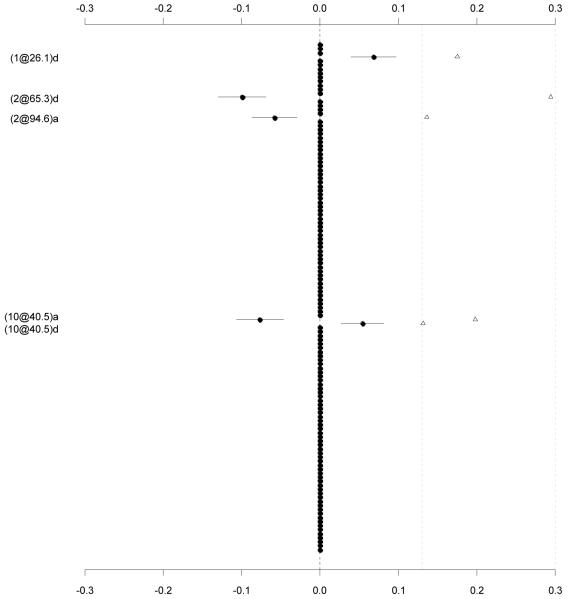
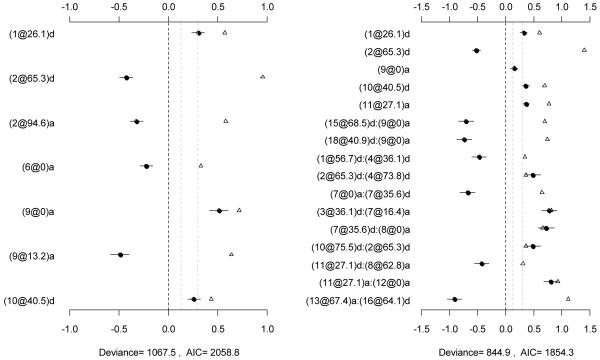
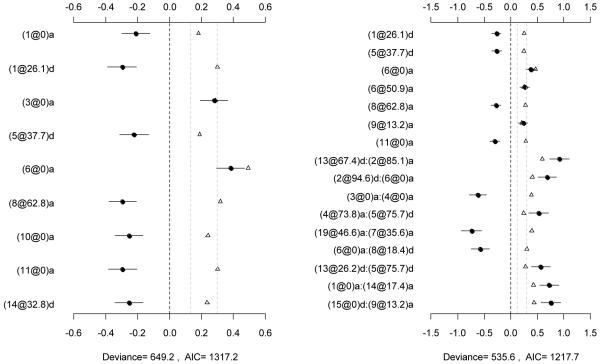
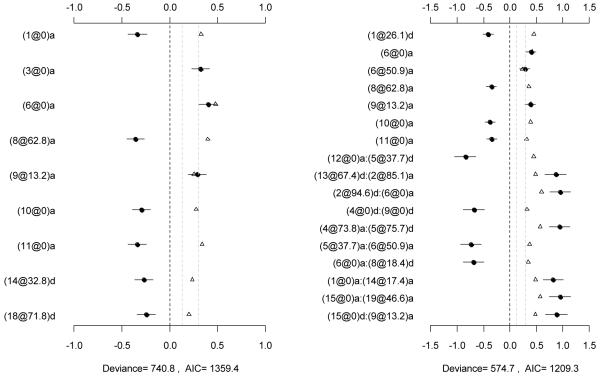
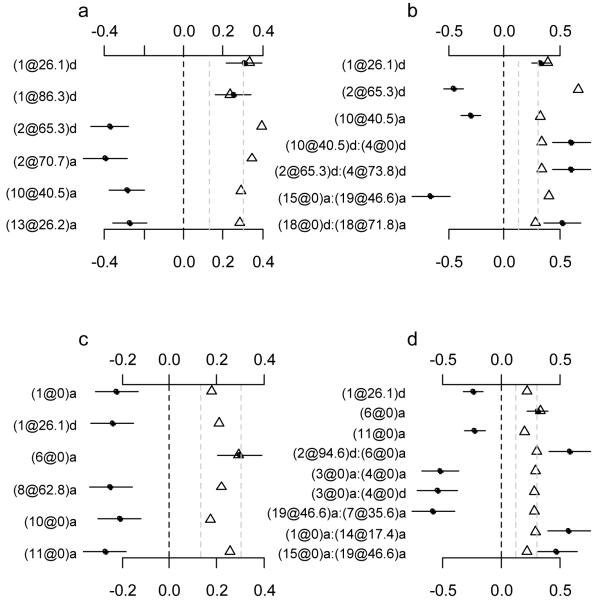
We proposed hierarchical Poisson and binomial models for mapping multiple interacting quantitative trait loci (QTLs) for count traits in experimental crosses. We applied our methods to two counted reproductive traits, live fetuses (LF) and dead fetuses (DF) at 17 days gestation, in an F2 female mouse population. We treated observed number of corpora lutea (ovulation rate) as the baseline and the total trials in our Poisson and binomial models, respectively. We detected more than 10 QTLs for LF and DF, most having epistatic and pleiotropic effects. The epistatic effects were larger, involved more QTLs, and explained a larger proportion of phenotypic variance than the main effects. Our analyses revealed a complex network of multiple interacting QTLs for the reproductive traits, and increase our understanding of the genetic architecture of reproductive characters. The proposed statistical models and methods provide valuable tools for detecting multiple interacting QTLs for complex count phenotypes.
Figures
Similar articles
-
A large-sample QTL study in mice: III. Reproduction.Mamm Genome. 2004 Nov;15(11):878-86. doi: 10.1007/s00335-004-2364-6. Mamm Genome. 2004. PMID: 15672592
-
Bayesian mapping of genomewide interacting quantitative trait loci for ordinal traits.Genetics. 2007 Jul;176(3):1855-64. doi: 10.1534/genetics.107.071142. Epub 2007 May 16. Genetics. 2007. PMID: 17507680 Free PMC article.
-
Use of randomization testing to detect multiple epistatic QTLs.Genet Res. 2002 Apr;79(2):175-84. doi: 10.1017/s001667230200558x. Genet Res. 2002. PMID: 12073555
-
Quantitative trait loci identification and meta-analysis for rice panicle-related traits.Mol Genet Genomics. 2016 Oct;291(5):1927-40. doi: 10.1007/s00438-016-1227-7. Epub 2016 Jul 5. Mol Genet Genomics. 2016. PMID: 27380139
-
Advances in Bayesian multiple quantitative trait loci mapping in experimental crosses.Heredity (Edinb). 2008 Mar;100(3):240-52. doi: 10.1038/sj.hdy.6801074. Epub 2007 Nov 7. Heredity (Edinb). 2008. PMID: 17987056 Free PMC article. Review.
Cited by
-
Statistical analysis of genetic interactions.Genet Res (Camb). 2010 Dec;92(5-6):443-59. doi: 10.1017/S0016672310000595. Genet Res (Camb). 2010. PMID: 21429274 Free PMC article. Review.
References
-
- Avalos E, Smith C. Genetic improvement of litter size in pigs. Anim. Prod. 1987;44:153–164.
-
- Bennett GL, Leymaster KA. Integration of ovulation rate, potential embryonic viability and uterine capacity into a model of litter size in swine. J. Anim. Sci. 1989;67:1230–1241. - PubMed
-
- Carlborg Ö, Haley CS. Epistasis: too often neglected in complex trait studies? Nat. Rev. Genet. 2004;5:618–625. - PubMed
-
- Casella G, Berger RL. Statistical Inference. Ed. 2. Duxbury Press; Belmont: 2001.
-
- Cassady JP, Johnson RK, Pomp D, Rohrer GA, Van Vleck LD, et al. Identification of quantitative trait loci affecting reproduction in pigs. J. Anim. Sci. 2001;79:623–633. - PubMed
Publication types
MeSH terms
Grants and funding
LinkOut - more resources
Full Text Sources
Miscellaneous