

Robust adaptive 3-D segmentation of vessel laminae from fluorescence confocal microscope images and parallel GPU implementation
- PMID: 20199906
- PMCID: PMC2852140
- DOI: 10.1109/TMI.2009.2022086
Robust adaptive 3-D segmentation of vessel laminae from fluorescence confocal microscope images and parallel GPU implementation
Abstract
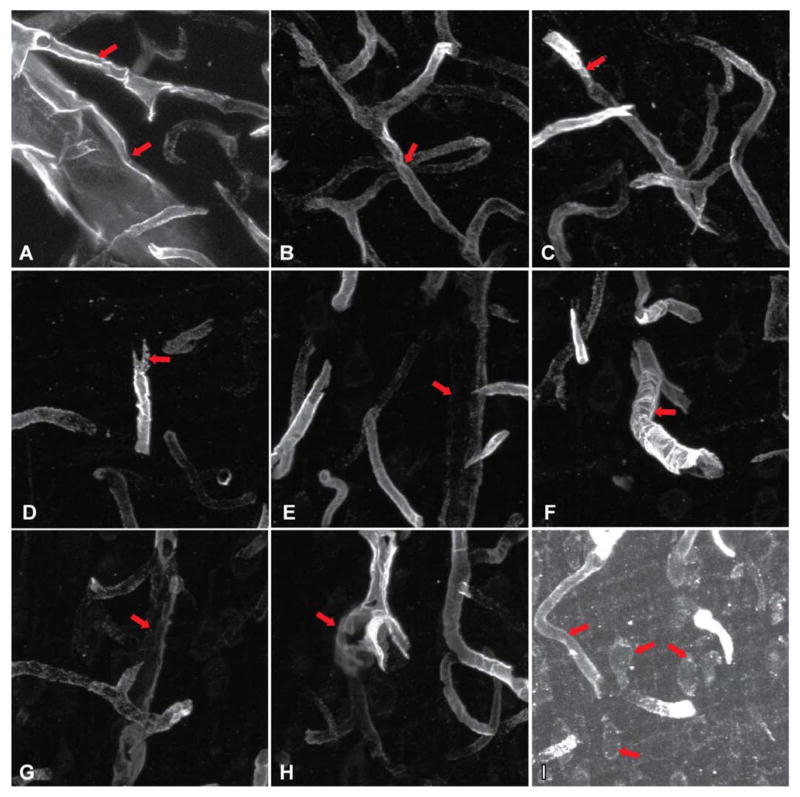
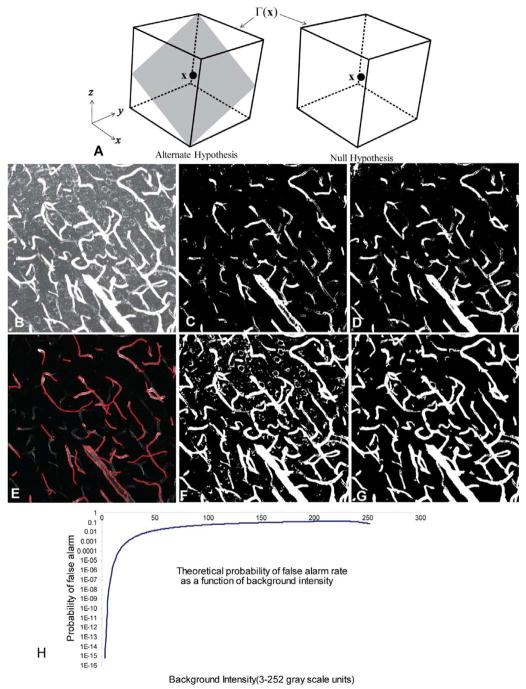
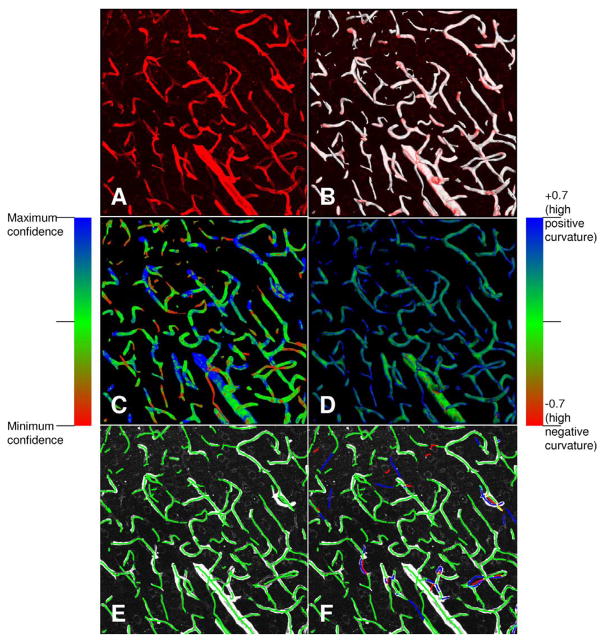
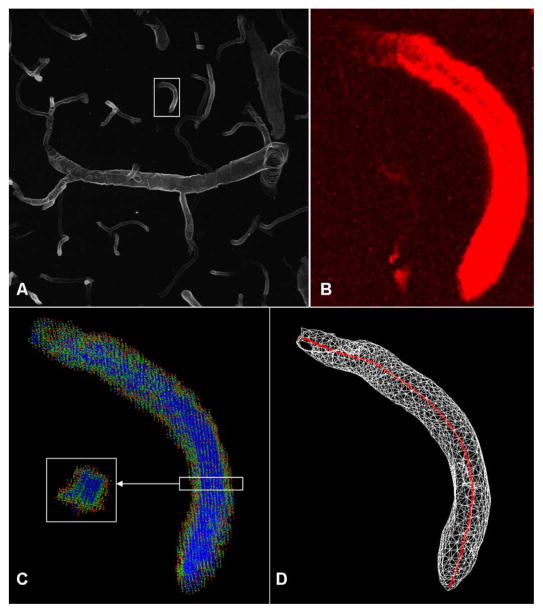
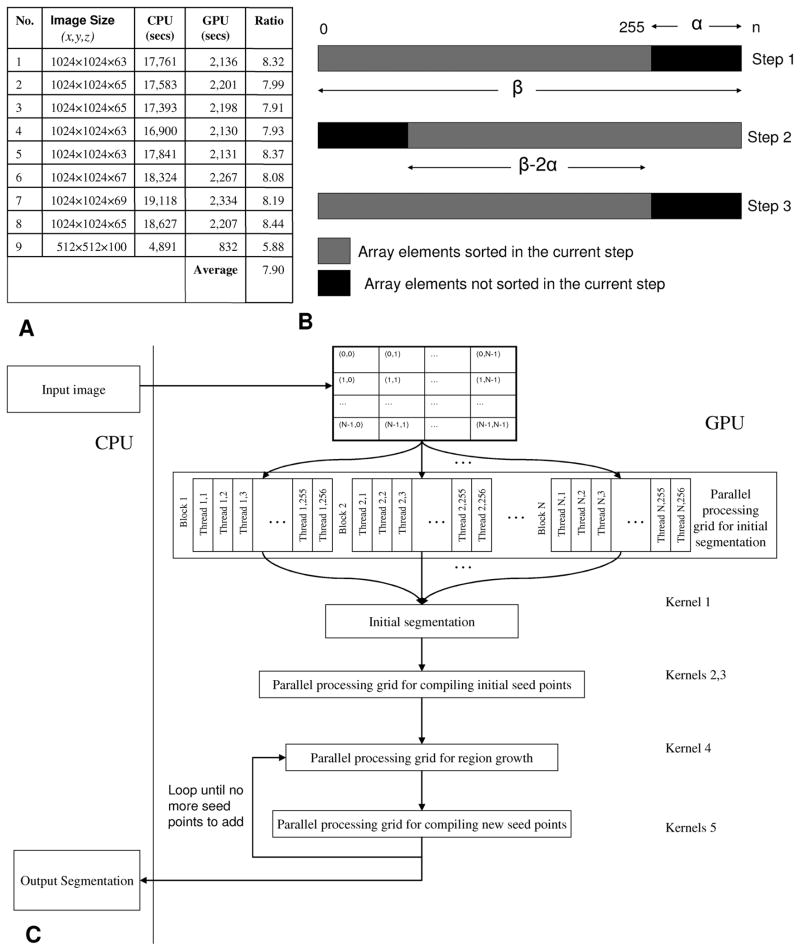
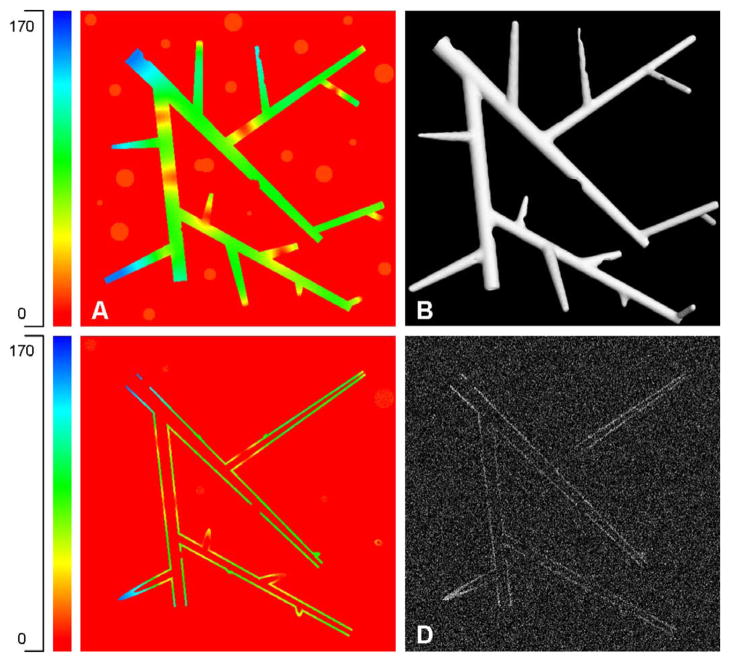
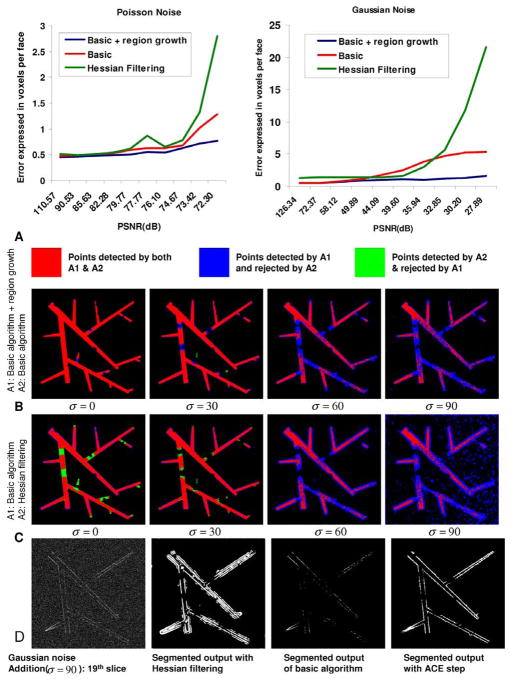
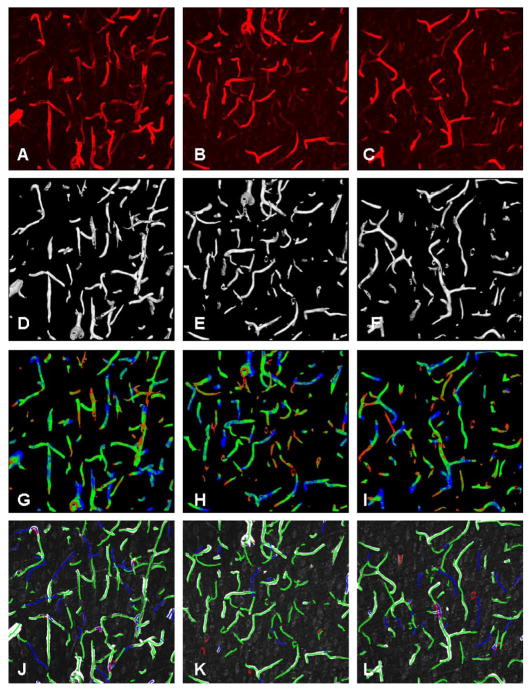
This paper presents robust 3-D algorithms to segment vasculature that is imaged by labeling laminae, rather than the lumenal volume. The signal is weak, sparse, noisy, nonuniform, low-contrast, and exhibits gaps and spectral artifacts, so adaptive thresholding and Hessian filtering based methods are not effective. The structure deviates from a tubular geometry, so tracing algorithms are not effective. We propose a four step approach. The first step detects candidate voxels using a robust hypothesis test based on a model that assumes Poisson noise and locally planar geometry. The second step performs an adaptive region growth to extract weakly labeled and fine vessels while rejecting spectral artifacts. To enable interactive visualization and estimation of features such as statistical confidence, local curvature, local thickness, and local normal, we perform the third step. In the third step, we construct an accurate mesh representation using marching tetrahedra, volume-preserving smoothing, and adaptive decimation algorithms. To enable topological analysis and efficient validation, we describe a method to estimate vessel centerlines using a ray casting and vote accumulation algorithm which forms the final step of our algorithm. Our algorithm lends itself to parallel processing, and yielded an 8 x speedup on a graphics processor (GPU). On synthetic data, our meshes had average error per face (EPF) values of (0.1-1.6) voxels per mesh face for peak signal-to-noise ratios from (110-28 dB). Separately, the error from decimating the mesh to less than 1% of its original size, the EPF was less than 1 voxel/face. When validated on real datasets, the average recall and precision values were found to be 94.66% and 94.84%, respectively.
Figures
Similar articles
-
Adaptive nonlocal means filtering based on local noise level for CT denoising.Med Phys. 2014 Jan;41(1):011908. doi: 10.1118/1.4851635. Med Phys. 2014. PMID: 24387516
-
A nonvoxel-based dose convolution/superposition algorithm optimized for scalable GPU architectures.Med Phys. 2014 Oct;41(10):101711. doi: 10.1118/1.4895822. Med Phys. 2014. PMID: 25281950
-
Median-based robust algorithms for tracing neurons from noisy confocal microscope images.IEEE Trans Inf Technol Biomed. 2003 Dec;7(4):302-17. doi: 10.1109/titb.2003.816564. IEEE Trans Inf Technol Biomed. 2003. PMID: 15000357
-
A vessel segmentation method for multi-modality angiographic images based on multi-scale filtering and statistical models.Biomed Eng Online. 2016 Nov 8;15(1):120. doi: 10.1186/s12938-016-0241-7. Biomed Eng Online. 2016. PMID: 27825346 Free PMC article.
-
Medical image segmentation on GPUs--a comprehensive review.Med Image Anal. 2015 Feb;20(1):1-18. doi: 10.1016/j.media.2014.10.012. Epub 2014 Dec 2. Med Image Anal. 2015. PMID: 25534282 Review.
Cited by
-
Cerebral vascular structure in the motor cortex of adult mice is stable and is not altered by voluntary exercise.J Cereb Blood Flow Metab. 2017 Dec;37(12):3725-3743. doi: 10.1177/0271678X16682508. Epub 2017 Jan 6. J Cereb Blood Flow Metab. 2017. PMID: 28059584 Free PMC article.
-
Ultraliser: a framework for creating multiscale, high-fidelity and geometrically realistic 3D models for in silico neuroscience.Brief Bioinform. 2023 Jan 19;24(1):bbac491. doi: 10.1093/bib/bbac491. Brief Bioinform. 2023. PMID: 36434788 Free PMC article.
-
From whole-organ imaging to in-silico blood flow modeling: A new multi-scale network analysis for revisiting tissue functional anatomy.PLoS Comput Biol. 2020 Feb 14;16(2):e1007322. doi: 10.1371/journal.pcbi.1007322. eCollection 2020 Feb. PLoS Comput Biol. 2020. PMID: 32059013 Free PMC article.
-
Computational tissue volume reconstruction of a peripheral nerve using high-resolution light-microscopy and reconstruct.PLoS One. 2013 Jun 13;8(6):e66191. doi: 10.1371/journal.pone.0066191. Print 2013. PLoS One. 2013. PMID: 23785485 Free PMC article.
-
A broadly applicable 3-D neuron tracing method based on open-curve snake.Neuroinformatics. 2011 Sep;9(2-3):193-217. doi: 10.1007/s12021-011-9110-5. Neuroinformatics. 2011. PMID: 21399937
References
-
- Kirbas C, Quek FKH. A review of vessel extraction techniques and algorithms. ACM Comput Surv. 2004;36:81–121.
-
- Tyrrell JA, Tomaso ED, Fuja D, Tong R, Kozak K, Jain RK, Roysam B. Robust 3-D modeling of vasculature imagery using superellipsoids. IEEE Trans Med Imag. 2007 Feb;26(2):223–237. - PubMed
-
- Moore KA, Lemischka IR. Stem cells and their niches. Science. 2006;311(5769):1880–1885. - PubMed
-
- Calabrese C, Poppleton H, Kocak M, Hogg T, Fuller C, Hamner B, Oh E, Gaber M, Finklestein D, Allen M. A perivascular niche for brain tumor stem cells. Cancer Cell. 2007;11(1):69–82. - PubMed
Publication types
MeSH terms
Grants and funding
LinkOut - more resources
Full Text Sources
Other Literature Sources
Miscellaneous
