

Modeling the performance characteristics of computed radiography (CR) systems
- PMID: 20199915
- PMCID: PMC5228607
- DOI: 10.1109/TMI.2009.2036995
Modeling the performance characteristics of computed radiography (CR) systems
Abstract
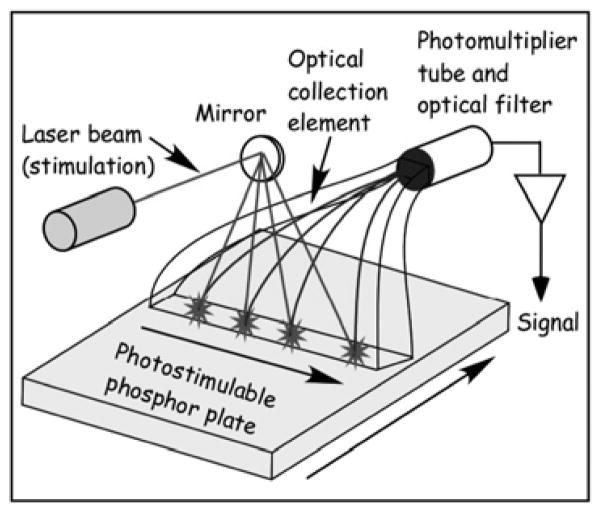
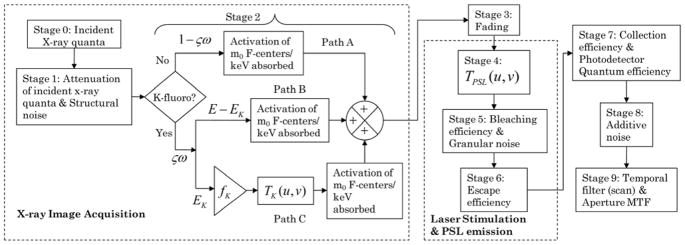
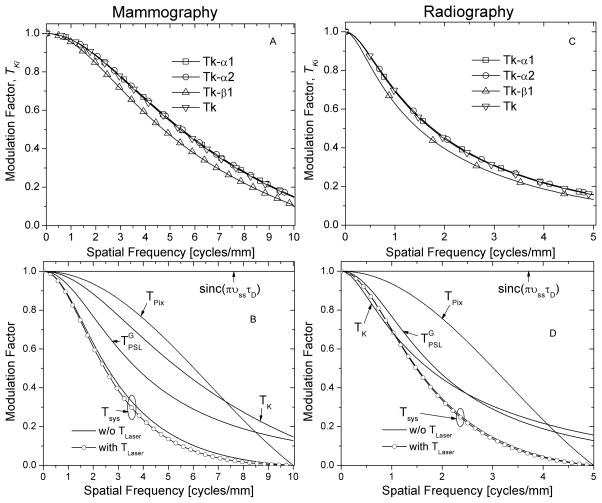
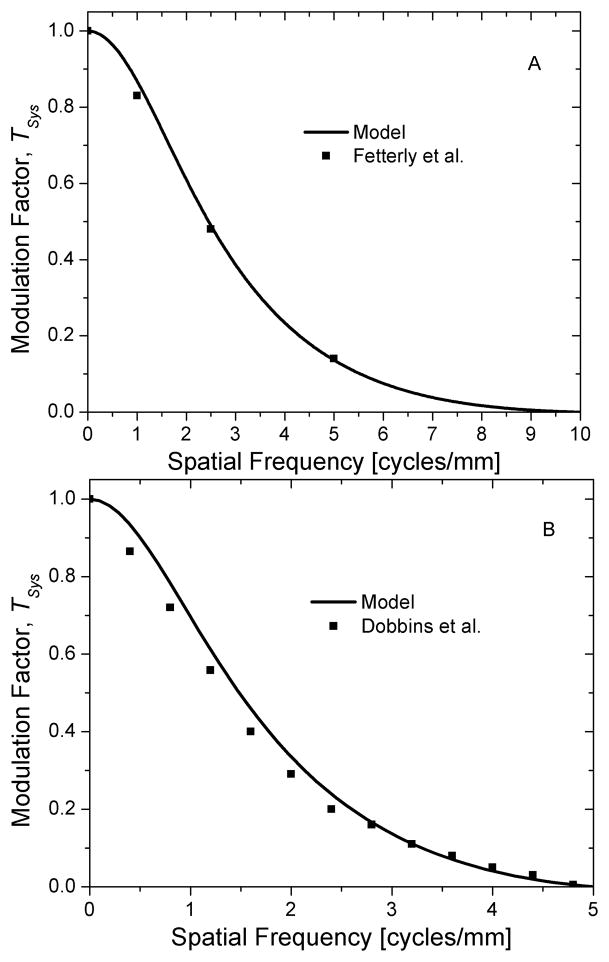
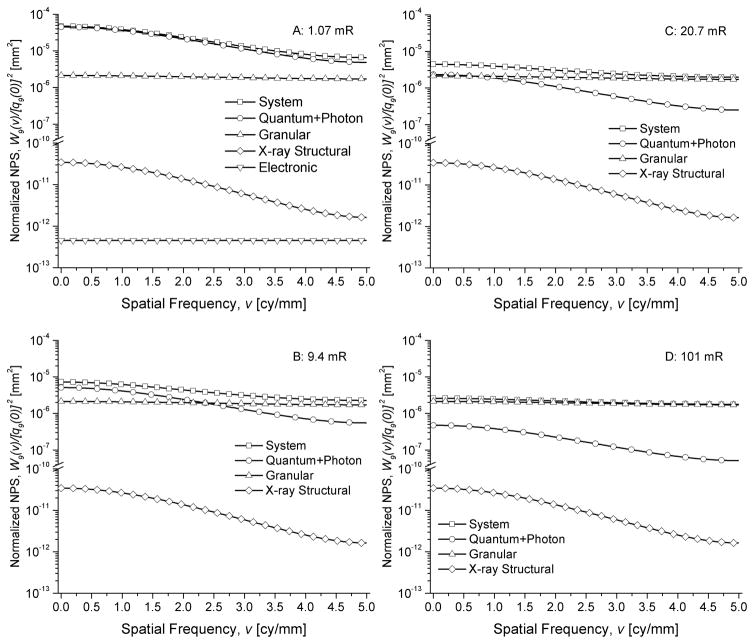
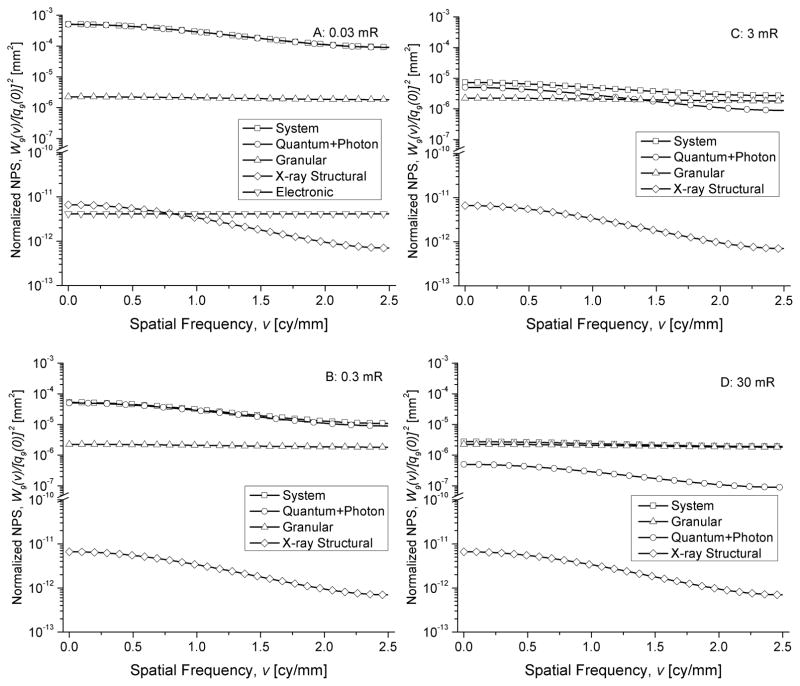
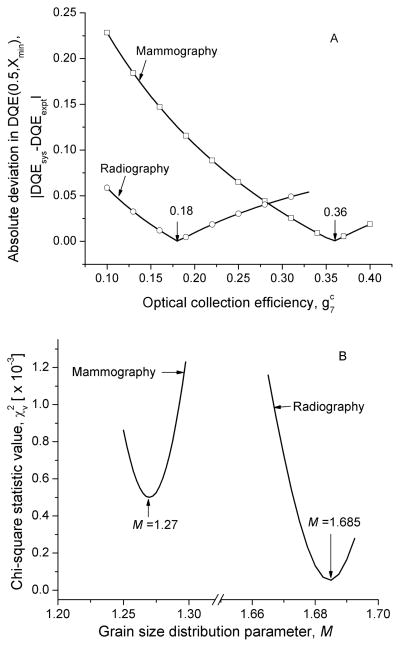
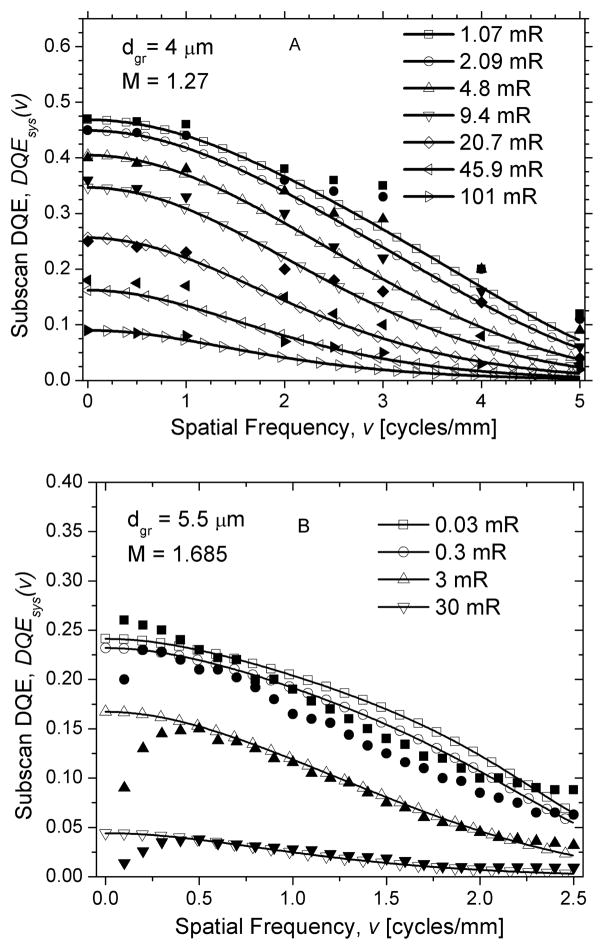
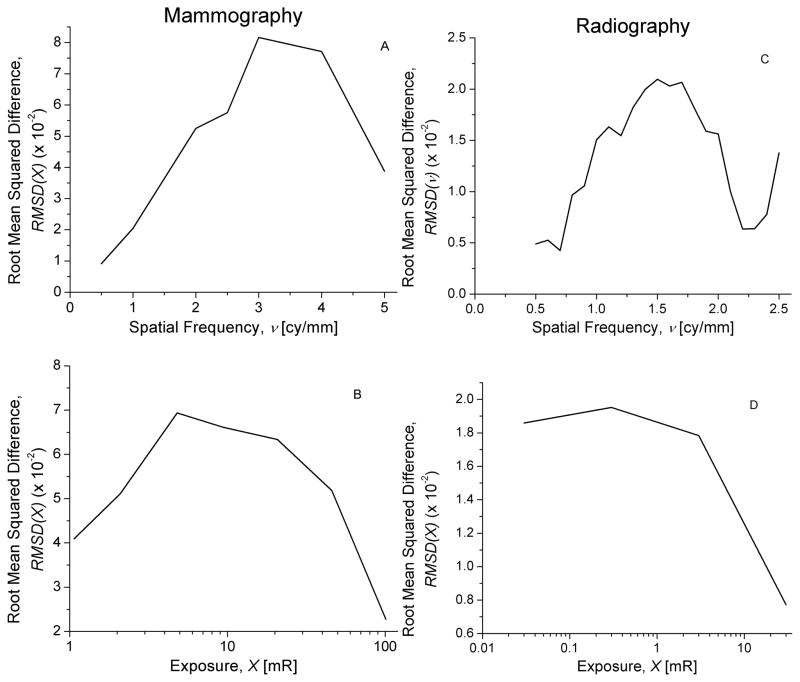
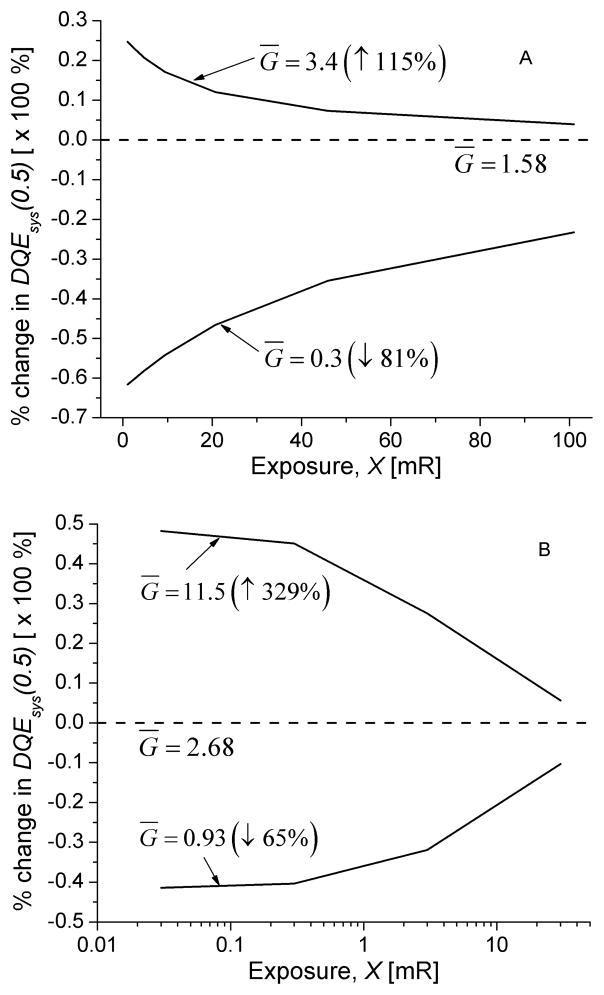
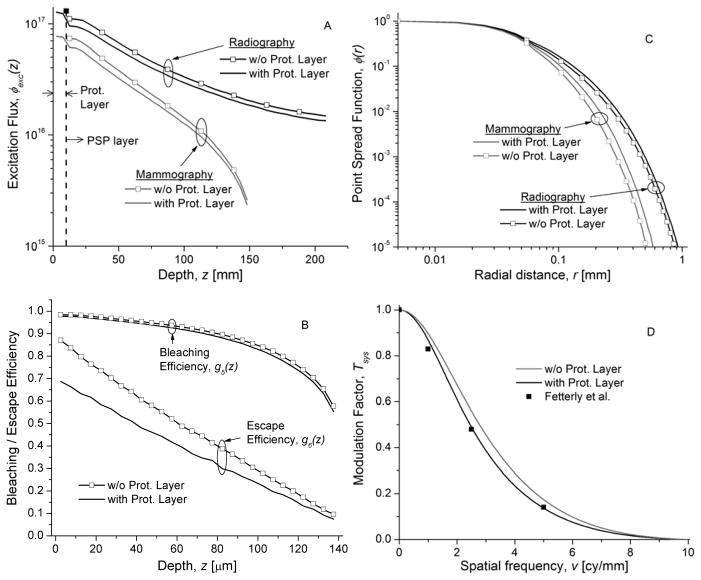
Computed radiography (CR) using storage phosphors is widely used in digital radiography and mammography. A cascaded linear systems approach wherein several parameter values were estimated using Monte Carlo methods was used to model the image formation process of a single-side read ;;flying spot'' CR system using a granular phosphor. Objective image quality metrics such as modulation transfer function and detective quantum efficiency were determined using this model and show good agreement with published empirical data. A model such as that addressed in this work could allow for improved understanding of the effect of storage phosphor physical properties and CR reader parameters on objective image quality metrics for existing and evolving CR systems.
Figures
Similar articles
-
Characterization of noise sources for two generations of computed radiography systems using powder and crystalline photostimulable phosphors.Med Phys. 2007 Aug;34(8):3345-57. doi: 10.1118/1.2750973. Med Phys. 2007. PMID: 17879798
-
Physical evaluation of a needle photostimulable phosphor based CR mammography system.Med Phys. 2012 Feb;39(2):811-24. doi: 10.1118/1.3675403. Med Phys. 2012. PMID: 22320791
-
Signal detectability in digital radiography: spatial domain figures of merit.Med Phys. 2003 Aug;30(8):2180-93. doi: 10.1118/1.1578485. Med Phys. 2003. PMID: 12945984
-
Cassette-based digital mammography.Technol Cancer Res Treat. 2004 Oct;3(5):413-27. doi: 10.1177/153303460400300502. Technol Cancer Res Treat. 2004. PMID: 15453806 Review.
-
Status and prospects of digital detector technology for CR and DR.Radiat Prot Dosimetry. 2005;114(1-3):32-8. doi: 10.1093/rpd/nch532. Radiat Prot Dosimetry. 2005. PMID: 15933078 Review.
Cited by
-
Radiation Detectors and Sensors in Medical Imaging.Sensors (Basel). 2024 Sep 26;24(19):6251. doi: 10.3390/s24196251. Sensors (Basel). 2024. PMID: 39409289 Free PMC article. Review.
-
Maximizing microcalcification detectability in low-dose dedicated cone-beam breast CT: parallel cascades-based theoretical analysis.J Med Imaging (Bellingham). 2024 May;11(3):033501. doi: 10.1117/1.JMI.11.3.033501. Epub 2024 May 15. J Med Imaging (Bellingham). 2024. PMID: 38756437 Free PMC article.
-
Emerging Breast Imaging Technologies on the Horizon.Semin Ultrasound CT MR. 2018 Feb;39(1):114-121. doi: 10.1053/j.sult.2017.09.004. Epub 2017 Sep 13. Semin Ultrasound CT MR. 2018. PMID: 29317033 Free PMC article.
References
-
- Sonoda M, Takano M, Miyahara J, Kato H. Computed radiography utilizing scanning laser stimulated luminescence. Radiology. 1983 Sep;148:833–8. - PubMed
-
- Fajardo LL, Hillman BJ, Hunter TB, Claypool HR, Westerman BR, Mockbee B. Excretory urography using computed radiography. Radiology. 1987 Feb;162:345–51. - PubMed
-
- Lindhardt FE. Clinical experiences with computed radiography. Eur J Radiol. 1996 Jun;22:175–85. - PubMed
-
- Seibert JA, Shelton DK, Moore EH. Computed radiography X-ray exposure trends. Acad Radiol. 1996 Apr;3:313–8. - PubMed
-
- Sherrier RH, Chotas HG, Johnson GA, Chiles C, Ravin CE. Image optimization in a computed-radiography/photostimulable-phosphor system. J Digit Imaging. 1989 Nov;2:212–9. - PubMed
Publication types
MeSH terms
Grants and funding
LinkOut - more resources
Full Text Sources
Other Literature Sources
