. 2010 Mar;29(3):938-49.
doi: 10.1109/TMI.2010.2040188.

Application and evaluation of a measured spatially variant system model for PET image reconstruction

Affiliations

Application and evaluation of a measured spatially variant system model for PET image reconstruction

Adam M Alessio et al. IEEE Trans Med Imaging. 2010 Mar.

Abstract

Accurate system modeling in tomographic image reconstruction has been shown to reduce the spatial variance of resolution and improve quantitative accuracy. System modeling can be improved through analytic calculations, Monte Carlo simulations, and physical measurements. The purpose of this work is to improve clinical fully-3-D reconstruction without substantially increasing computation time. We present a practical method for measuring the detector blurring component of a whole-body positron emission tomography (PET) system to form an approximate system model for use with fully-3-D reconstruction. We employ Monte Carlo simulations to show that a non-collimated point source is acceptable for modeling the radial blurring present in a PET tomograph and we justify the use of a Na22 point source for collecting these measurements. We measure the system response on a whole-body scanner, simplify it to a 2-D function, and incorporate a parameterized version of this response into a modified fully-3-D OSEM algorithm. Empirical testing of the signal versus noise benefits reveal roughly a 15% improvement in spatial resolution and 10% improvement in contrast at matched image noise levels. Convergence analysis demonstrates improved resolution and contrast versus noise properties can be achieved with the proposed method with similar computation time as the conventional approach. Comparison of the measured spatially variant and invariant reconstruction revealed similar performance with conventional image metrics. Edge artifacts, which are a common artifact of resolution-modeled reconstruction methods, were less apparent in the spatially variant method than in the invariant method. With the proposed and other resolution-modeled reconstruction methods, edge artifacts need to be studied in more detail to determine the optimal tradeoff of resolution/contrast enhancement and edge fidelity.


Figures

Fig. 1
Fig. 1
FWHM and FWTM of S(s; sv) formed from non-collimated and collimated point source at different locations.
Fig. 2
Fig. 2
Comparison of S(s; sv) from simulated collimated (dash dot), simulated non-collimated (dash), and measured non-collimated (solid) point sources. The y-axis is normalized units such that each S(s; sv) has anarea under the curve of one.
Fig. 3
Fig. 3
Comparison of positron range of F18 in water (a) and Na22 in Lucite (b). Binary images (a) and (b) show positron annihilation coordinates projected on a single axis. Plot (c) shows the projection of (a) and (b) onto a single axis with F18 (solid) and Na (dashed). The histogram (d) reveals of positron distance of F18 (solid) and Na (dashed).
Fig. 4
Fig. 4
Radial profiles through 15 separate sinogram data sets at azimuthal angle 0 for a point source positioned at 15 locations sv = 2.5 mm through 38.1 mm. Data acquired from point source measurements at center of transaxial FOV. Second row contains profiles shifted to have same max location. These radial bins have an average spacing of 2.5 mm.
Fig. 5
Fig. 5
Radial profiles through 14 separate sinogram data sets at azimuthal angle 0. Data acquired from point source measurements at edge of transaxial FOV for a point source positioned at 14 location sv = −310 mm through −274.4 mm. Second row contains profiles shifted to have same max location. These radial bins have an average spacing of 1.9 mm.
Fig. 6
Fig. 6
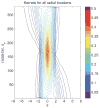
Isocontour plot of radial blurring kernels interpolated to all radial positions, sv.
Fig. 7
Fig. 7
Measured radial profiles (solid) and parameterized radial profiles (dashed) at positions 118 mm and 184 mm from center of FOV.
Fig. 8
Fig. 8
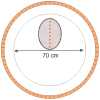
Illustration of transaxial view of line source phantom positioned in 70 cm bore of scanner.
Fig. 9
Fig. 9
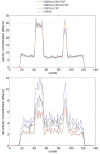
Reconstructions of line source phantom with OSEM+LOR (first row), OSEM+LOR+PSF (second row), and radial profile (third row) after the completion of different iterations (noted in heading). The subheading for each image contains the range and mean value of the image in kBq/cc. The radial profiles extend vertically through the second to most extreme radially positioned line source (22.4 cm from center of FOV) and are presented for OSEM+LOR (+) and OSEM+LOR+PSF (○). Average radial FWHM listed in each profile plot.
Fig. 10
Fig. 10
Average transaxial resolution versus location measured from phantom with eight axial line sources with first column from line sources in air, second column from line sources in warm background after 10 iterations, and third column from line sources in warm background after 20 iterations. Error bars denote the standard error in the estimate of the mean FWHM values across eight neighboring transaxial slices. The solid line is fit to the mean FWHM values to show trend with radial locations. All reconstructions with 28 subsets, no postfilter, 1.37 mm/pixel.
Fig. 11
Fig. 11
Transaxial resolution at 5.1 cm (left) and 22.2 cm (right) versus image update measured from phantom with 8 axial line sources in warm background.
Fig. 12
Fig. 12
Transaxial resolution at 5.1 cm (left) and 22.2 cm (right) versus coefficient of variation in background voxels from line sources in warm background phantom. Lines parameterized by every iteration with initial images in upper left and 20 iterations, 28 subsets image in lower right.
Fig. 13
Fig. 13
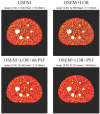
Zoomed transxial view of NEMA IQ phantom from one of 50 acquisitions. Each image reconstructed with different algorithm after eight iterations.
Fig. 14
Fig. 14
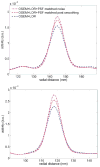
Profile through transaxial slice from one of 50 acquisitions of NEMA IQ phantom (profile through slices in Fig. 13). Dashed lines mark true background and hot sphere values.
Fig. 15
Fig. 15
Mean of 50 independent images of NEMA IQ phantom reconstructed with different algorithms after eight iterations. Top row contains transaxial view; bottom row contains coronal view.
Fig. 16
Fig. 16
Standard deviation of 50 independent images reconstructed with different algorithms after eight iterations. OSEM+LOR+PSF has the lowest deviation across realizations. All images have a matched colorscale.
Fig. 17
Fig. 17
Profile through transaxial slice of mean image (top) and standard deviation image (bottom) after eight iterations. Dashed lines mark true background and hot sphere values.
Fig. 18
Fig. 18
Contrast recovery coefficient (CRC) for mean value of sphere versus sphere size after 8 iterations. Error bars mark the standard deviation of CRC values across the 50 independent acquisitions.
Fig. 19
Fig. 19
CRC versus “true” noise (bottom) for 35 cm background ROI. Error bars denote standard deviation in CRC across 50 realizations. Circles mark end of 4 and 8 iterations.
Fig. 20
Fig. 20
Local correlation images for a pixel in the background of the NEMA IQ phantom. OSEM+LOR (left) and OSEM+LOR+PSF (right) correlation images show correlation of 1 with itself (center of image) and positive and negative correlations with neighboring pixels.
Fig. 21
Fig. 21
Coronal view of whole-body FDG exam reconstructed with OSEM+LOR (top row) and OSEM+LOR+PSF (bottom row). Images presented after four iterations, 28 subsets with no postfilter (column 1), 3.5 mm postfilter (column 2), and 7 mm postfilter (column 3).
Fig. 22
Fig. 22
Radial profiles through two left ribs from whole-body patient exam from Fig. 21. Profiles through OSEM+LOR with 7 mm postsmoothing, OSEM+LOR+PSF with 7 mm postsmoothing, and OSEM+LOR+PSF with 6 mm postsmoothing, which has matched liver noise with the OSEM+LOR image.
Fig. 23
Fig. 23
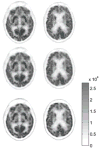
Two transaxial slices from OSEM+LOR (row 1), OSEM+LOR+3 mm postfilter (row 2), and OSEM+LOR+PSF (row 3). All images have matched color scales and row 2 and row 3 have matched pixel-to-pixel variability in central white matter.
Fig. 24
Fig. 24
Two coronal slices from OSEM+LOR (row 1), OSEM+LOR+3 mm postfilter (row 2), and OSEM+LOR+PSF (row 3). All images have matched color scales and row 2 and row 3 have matched pixel-to-pixel variability in central white matter.

Similar articles

Cited by

References

    1. Schmitt D, Karuta B, Carrier C, Lecomte R. Fast point spread function computation from aperture functions in high-resolution positron emission tomography. IEEE Trans Med Imag. 1988 Mar;7(1):2–12. - PubMed
    1. Strul D, Slates RB, Dahlbom M, Cherry SR, Marsden PK. An improved analytical detector response function model for multilayer small-diameter PET scanners. Phys Med Biol. 2003;48(8):979–994. - PubMed
    1. Qi J, Leahy RM, Cherry SR, Chatziioannou A, Farquhar TH. High-resolution 3-D Bayesian image reconstruction using the microPET small-animal scanner. Phys Med Biol. 1998;43(4):1001–1013. - PubMed
    1. Mumcuoglu E, Leahy R, Cherry S, Hoffman E. Accurate geometric and physical response modelling for statistical image reconstruction in high resolution PET. Proc IEEE Nucl Sci Symp Med Imag Conf. 1996;3:1569–1573.
    1. Frese T, Rouze NC, Bouman CA, Sauer K, Hutchins GD. Quantitative comparison of FBP, EM, and Bayesian reconstruction algorithms for the IndyPET scanner. IEEE Trans Med Imag. 2003 Feb;22(2):258–76. - PubMed

Publication types