. 2010 May;153(1):128-44.
doi: 10.1104/pp.109.149708. Epub 2010 Mar 3.

Auxin metabolism and function in the multicellular brown alga Ectocarpus siliculosus

Affiliations

Auxin metabolism and function in the multicellular brown alga Ectocarpus siliculosus

Aude Le Bail et al. Plant Physiol. 2010 May.

Abstract

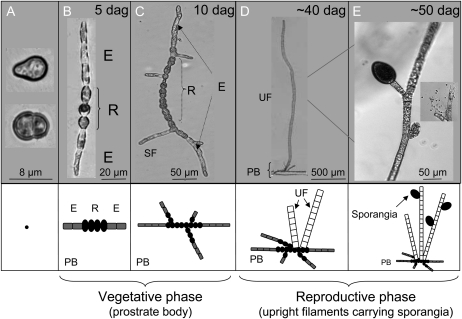
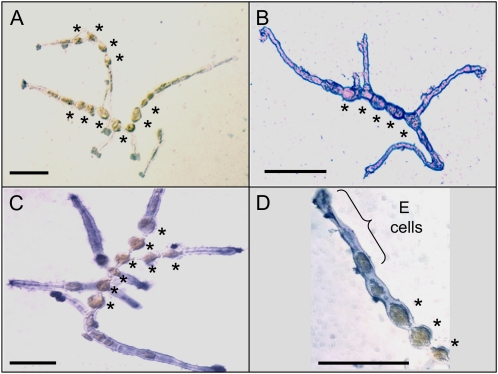
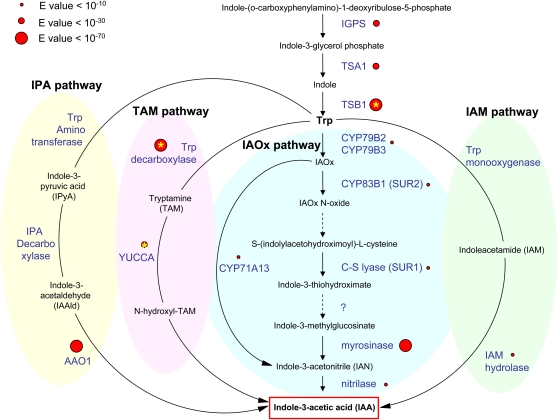
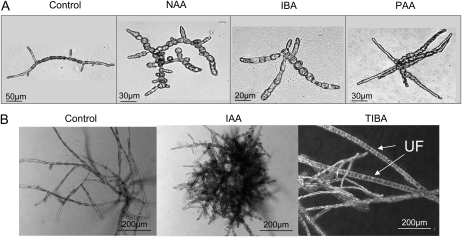
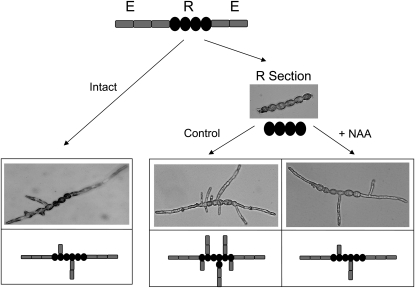
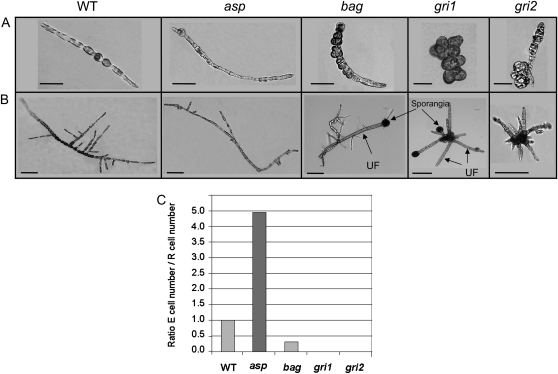
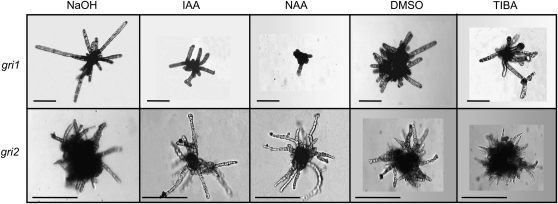
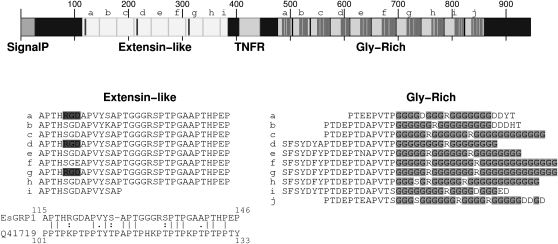
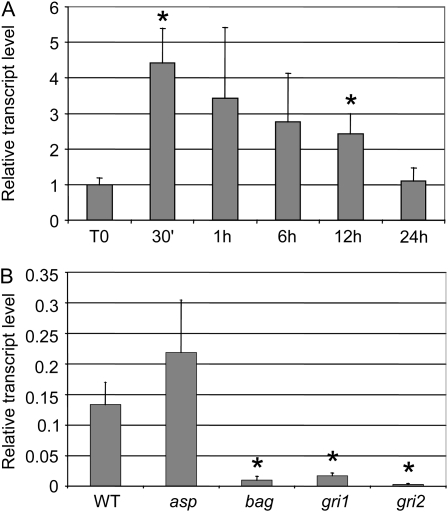
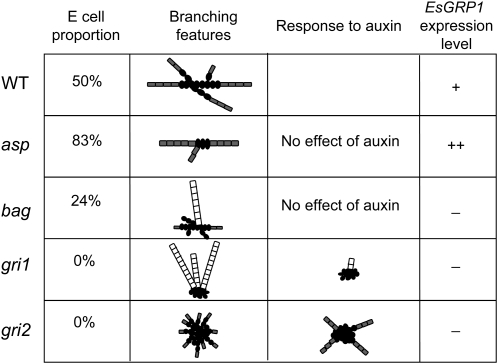
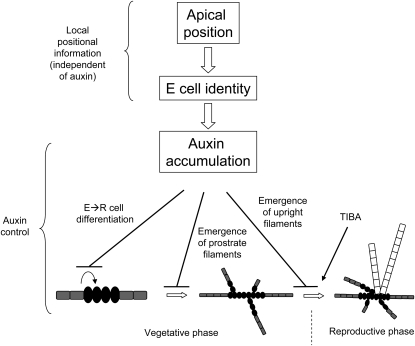
Ectocarpus siliculosus is a small brown alga that has recently been developed as a genetic model. Its thallus is filamentous, initially organized as a main primary filament composed of elongated cells and round cells, from which branches differentiate. Modeling of its early development suggests the involvement of very local positional information mediated by cell-cell recognition. However, this model also indicates that an additional mechanism is required to ensure proper organization of the branching pattern. In this paper, we show that auxin indole-3-acetic acid (IAA) is detectable in mature E. siliculosus organisms and that it is present mainly at the apices of the filaments in the early stages of development. An in silico survey of auxin biosynthesis, conjugation, response, and transport genes showed that mainly IAA biosynthesis genes from land plants have homologs in the E. siliculosus genome. In addition, application of exogenous auxins and 2,3,5-triiodobenzoic acid had different effects depending on the developmental stage of the organism, and we propose a model in which auxin is involved in the negative control of progression in the developmental program. Furthermore, we identified an auxin-inducible gene called EsGRP1 from a small-scale microarray experiment and showed that its expression in a series of morphogenetic mutants was positively correlated with both their elongated-to-round cell ratio and their progression in the developmental program. Altogether, these data suggest that IAA is used by the brown alga Ectocarpus to relay cell-cell positional information and induces a signaling pathway different from that known in land plants.


Figures

Figure 1.
Figure 1.
Morphology of the E. ssiliculosus sporophyte. The body of the E. siliculosus sporophyte is composed of two main parts: (1) the prostrate body attached to the substratum, corresponding to the vegetative phase; and (2) the upright body, corresponding to filaments growing vertically in seawater and ultimately differentiating sporangia. The prostrate body (PB) originates from germinating zygotes (or mitospores or unfertilized gametes; A), which produce a uniseriate filament composed of two cell types (B): E cells located at the apices and R cells at the center. About 10 d after germination (dag), the primary filament differentiates secondary prostrate axes (C). Upright filaments (UF) differentiate from the prostrate body, and these are composed of squared, large cells (D), ultimately developing sporangia (E).
Figure 2.
Figure 2.
Immunolocalization of IAA along the filaments of E. siliculosus. IAA was immunolocalized in very young sporophytic organisms (10 d old; blue-purple color; see “Materials and Methods”). A, Negative control corresponding to the omission of the primary antibody. B, α-Tubulin immunolocalization showing overall labeling. C, IAA immunolocalization showing the absence of IAA in the center of the filaments, corresponding mainly to R cells (stars). D, Detail of a filament apex after IAA immunolabeling, showing the absence of labeling in the central R cells. In these cells, the chloroplast is particularly visible as a golden brown area. Bars = 50 μm.
Figure 3.
Figure 3.
Indole compounds and putative enzymes involved in the synthesis of IAA in E. siliculosus. Substrates (black) and enzymes (blue) of the four biosynthetic pathways known or predicted in land plants (Woodward and Bartel, 2005; Nafisi et al., 2007; Sugawara et al., 2009) are presented. The indole product quantified in E. siliculosus sporophytes is framed in red. Putatively conserved enzymes inferred from genome sequence analysis of E. siliculosus are indicated by red dots. A yellow star indicates a BBH (see “Materials and Methods”).
Figure 4.
Figure 4.
Effects of auxin compounds on the development of E. siliculosus sporophytes. Different auxin compounds were applied to E. siliculosus spores at germination time (A) or 20 d after germination (B). The effects on morphology were observed 2 weeks later. Application of 50 μm NAA on mitospores resulted in the differentiation of cells with an abnormal shape. Growth polarity was also affected. Application of IBA led to a similar effect, yet weaker, and PAA produced organisms with very long terminal cells and an altered branching pattern. When auxin compounds were added later during development (at 20 d after germination), the observed effects were different. While IAA increased the production of prostrate filaments, TIBA induced the differentiation of upright filaments (UF) earlier than in the control.
Figure 5.
Figure 5.
Impact of NAA on branching. Pieces of filaments containing only R cells were isolated and grown in the presence or absence of 5 μm NAA (right). The developmental pattern of the filaments was observed 1 week after ablation, and the number of secondary filaments was counted (see text) and compared with the number obtained from intact filaments (left).
Figure 6.
Figure 6.
Morphology of the morphogenesis mutants. Phenotypes of the four mutants asp, bag, gri1, and gri2 compared with the wild type (WT). The phenotypes are shown 5 (A) and 15 (B) d after germination. UF, Upright filaments. Bars = 15 μm in A and 50 μm in B. C, Proportion of R cells. Both R cells and E cells were counted in 36 sporophytes from the two- to the 10-cell stage, and the ratio of the total number of each cell type was calculated (no. of cells > 200).
Figure 7.
Figure 7.
Response of E. iliculosus morphogenesis gri1 and gri2 mutants to auxin compounds. Fifty micromolar IAA, NAA, and TIBA were applied to gri1 and gri2 cultures. The morphology was observed 14 d later and compared with the control cultures (10−4 m NaOH for IAA and NAA and 0.1% dimethyl sulfoxide [DMSO] for TIBA). In gri1, upright branching was reduced upon application of IAA and inhibited in response to NAA. In response to TIBA, no significant change in morphology was observed. In gri2, IAA and NAA reduced the number of short secondary filaments and induced the growth of longer filaments. Bars = 50 μm.
Figure 8.
Figure 8.
Structure of the EsGRP1 protein. Four functional domains are identified in the peptide sequence of EsGRP1 predicted from the genome sequence. The signal peptide (amino acids 1–27) can be used to address the protein to the membrane. The extensin-like domain (amino acids 115–384) is made of 8.5 repeats (shown as boxes a–i) of a 32-amino acid module. Every three modules, the sequence contains an RGD motif (marked as vertical lines). The complete sequence of the repeats is shown below, with the RGD motif shaded. The alignment of the first module with one of the eight repeats of the Pro-rich extensin motif of Z. diploperennis (Q41719) shows a partial sequence similarity. The TNFR region (amino acids 406–444) matches with Prosite pattern PS00652, which is found in tumor necrosis factors and nerve growth factors. However, in tumor necrosis factor and nerve growth factor proteins, this pattern is present in three or four copies, usually located in the N-terminal part of the protein, which is not the case in EsGRP1. The Gly-rich region (amino acids 477–860, with the Gly residues marked as vertical lines) is made of 10 approximate repeats (boxes a–j). The complete sequence of this region is shown below the map, with the Gly residues shaded. Each repeat can be divided into two parts: the first eight to 19 amino acid residues correspond to a complex pattern, which can appear in more or less complete forms; the remaining 17 to 27 amino acid residues are mainly Gly.
Figure 9.
Figure 9.
Transcript levels of EsGRP1. The levels of transcripts of EsGRP1 were quantified by real-time reverse transcription-PCR on three independent biological replicates. Each transcript level was normalized to EsEF1α transcripts, as recommended by Le Bail et al. (2008b), and averaged (sd indicated). Asterisks indicate P < 0.05 with a t test. A, In response to NAA. Mature sporophytes were incubated for 24 h in 50 μm NAA, and tissues were collected at different times. After averaging, the transcript levels were normalized to the T0 value. B, In morphological mutants. WT, Wild type.
Figure 10.
Figure 10.
Summary of the phenotypic characterization of the mutants asp, bag, gri1, and gri2. The mutant phenotypes are summarized in terms of the proportion of E cells, branching features, response to auxin, and EsGRP1 transcript levels. For the branching features, note that it describes both prostrate filaments (gray) and upright filaments (white). R cells are shown as black ovals. WT, Wild type.
Figure 11.
Figure 11.
Model for the role of auxin in the development of the E. siliculosus sporophyte. Cells positioned at the apices of the filament acquire the E identity. A higher concentration of auxin is present in these cells, which prevents them from differentiating into R cells and/or inducing branching. As the filament grows, subapical E cells get localized farther from the apex and perceive lower auxin concentrations, which progressively induce their differentiation into R cells as well as branching. Later, auxin maintains its control on the progression of the life cycle by negatively controlling the emergence of the upright filament and thereby the shift to the reproductive phase. Auxin control would then depend on active transport, allowing the apices to maintain control on distant tissues.

Similar articles

Cited by

References

    1. Abad MJ, Bedoya LM, Bermejo P. (2008) Natural marine anti-inflammatory products. Mini Rev Med Chem 8: 740–754 - PubMed
    1. Altschul SF, Madden TL, Schäffer AA, Zhang J, Zhang Z, Miller W, Lipman DJ. (1997) Gapped BLAST and PSI-BLAST: a new generation of protein database search programs. Nucleic Acids Res 25: 3389–3402 - PMC - PubMed
    1. Armbrust EV, Berges JA, Bowler C, Green BR, Martinez D, Putnam NH, Zhou S, Allen AE, Apt KE, Bechner M, et al. (2004) The genome of the diatom Thalassiosira pseudonana: ecology, evolution, and metabolism. Science 306: 79–86 - PubMed
    1. Avsian-Kretchmer O, Cheng J, Chen L, Moctezuma E, Sung ZR. (2002) Indole acetic acid distribution coincides with vascular differentiation pattern during Arabidopsis leaf ontogeny. Plant Physiol 130: 199–209 - PMC - PubMed
    1. Baldauf SL. (2008) An overview of the phylogeny and diversity of eukaryotes. J Syst Evol 46: 263–273

Publication types

Substances

LinkOut - more resources