

MeCP2 is required for normal development of GABAergic circuits in the thalamus
- PMID: 20200124
- PMCID: PMC2867574
- DOI: 10.1152/jn.00601.2009
MeCP2 is required for normal development of GABAergic circuits in the thalamus
Abstract
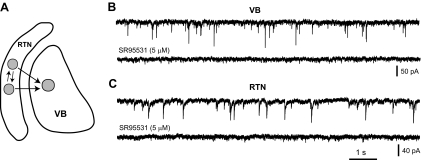
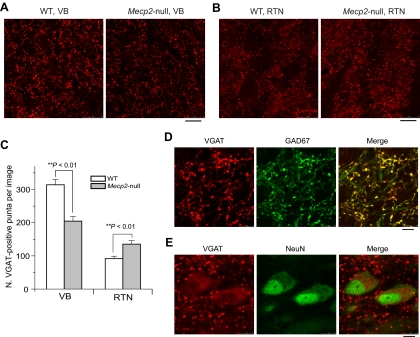
Methyl-CpG binding protein 2 (MeCP2) is highly expressed in neurons in the vertebrate brain, and mutations of the gene encoding MeCP2 cause the neurodevelopmental disorder Rett syndrome. This study examines the role of MeCP2 in the development and function of thalamic GABAergic circuits. Whole cell recordings were carried out in excitatory neurons of the ventrobasal complex (VB) of the thalamus and in inhibitory neurons of the reticular thalamic nucleus (RTN) in acute brain slices from mice aged P6 through P23. At P14-P16, the number of quantal GABAergic events was decreased in VB neurons but increased in RTN neurons of Mecp2-null mice, without any change in the amplitude or kinetics of quantal events. There was no difference between mutant and wild-type mice in paired-pulse ratios of evoked GABAergic responses in the VB or the RTN. On the other hand, unitary responses evoked by minimal stimulation were decreased in the VB but increased in the RTN of mutants. Similar changes in the frequency of quantal events were observed at P21-P23 in both the VB and RTN. At P6, however, quantal GABAergic transmission was altered only in the VB not the RTN. Immunostaining of vesicular GABA transporter showed opposite changes in the number of GABAergic synaptic terminals in the VB and RTN of Mecp2-null mice at P18-P20. The loss of MeCP2 had no significant effect on intrinsic properties of RTN neurons recorded at P15-P17. Our findings suggest that MeCP2 differentially regulates the development of GABAergic synapses in excitatory and inhibitory neurons in the thalamus.
Figures


Similar articles
-
Impaired transmission at corticothalamic excitatory inputs and intrathalamic GABAergic synapses in the ventrobasal thalamus of heterozygous BDNF knockout mice.Neuroscience. 2012 Oct 11;222:215-27. doi: 10.1016/j.neuroscience.2012.07.005. Epub 2012 Jul 13. Neuroscience. 2012. PMID: 22796079
-
Nucleus-specific differences in GABA(A)-receptor-mediated inhibition are enhanced during thalamic development.J Neurophysiol. 2000 Jan;83(1):350-8. doi: 10.1152/jn.2000.83.1.350. J Neurophysiol. 2000. PMID: 10634878
-
Defective GABAergic neurotransmission in the nucleus tractus solitarius in Mecp2-null mice, a model of Rett syndrome.Neurobiol Dis. 2018 Jan;109(Pt A):25-32. doi: 10.1016/j.nbd.2017.09.006. Epub 2017 Sep 18. Neurobiol Dis. 2018. PMID: 28927958 Free PMC article.
-
Functional consequences of the disturbances in the GABA-mediated inhibition induced by injuries in the cerebral cortex.Neural Plast. 2011;2011:614329. doi: 10.1155/2011/614329. Epub 2011 May 31. Neural Plast. 2011. PMID: 21766043 Free PMC article. Review.
-
Pathway-specific maturation of presynaptic functions of the somatosensory thalamus.Neurosci Res. 2022 Aug;181:1-8. doi: 10.1016/j.neures.2022.04.008. Epub 2022 May 2. Neurosci Res. 2022. PMID: 35513172 Review.
Cited by
-
Regulation of GABAA Receptor Subunit Expression in Substance Use Disorders.Int J Mol Sci. 2020 Jun 22;21(12):4445. doi: 10.3390/ijms21124445. Int J Mol Sci. 2020. PMID: 32580510 Free PMC article. Review.
-
Experience-dependent retinogeniculate synapse remodeling is abnormal in MeCP2-deficient mice.Neuron. 2011 Apr 14;70(1):35-42. doi: 10.1016/j.neuron.2011.03.001. Neuron. 2011. PMID: 21482354 Free PMC article.
-
GABA and glutamate pathways are spatially and developmentally affected in the brain of Mecp2-deficient mice.PLoS One. 2014 Mar 25;9(3):e92169. doi: 10.1371/journal.pone.0092169. eCollection 2014. PLoS One. 2014. PMID: 24667344 Free PMC article.
-
When norepinephrine becomes a driver of breathing irregularities: how intermittent hypoxia fundamentally alters the modulatory response of the respiratory network.J Neurosci. 2014 Jan 1;34(1):36-50. doi: 10.1523/JNEUROSCI.3644-12.2014. J Neurosci. 2014. PMID: 24381266 Free PMC article.
-
Early alterations in a mouse model of Rett syndrome: the GABA developmental shift is abolished at birth.Sci Rep. 2019 Jun 25;9(1):9276. doi: 10.1038/s41598-019-45635-9. Sci Rep. 2019. PMID: 31239460 Free PMC article.
References
-
- Akbarian S, Chen RZ, Gribnau J, Rasmussen TP, Fong H, Jaenisch R, Jones EG. Expression pattern of the Rett syndrome gene MeCP2 in primate prefrontal cortex. Neurobiol Dis 8: 784–791, 2001. - PubMed
-
- Amir RE, Van den Veyver IB, Wan M, Tran CQ, Francke U, Zoghbi HY. Rett syndrome is caused by mutations in X-linked MECP2, encoding methyl-CpG-binding protein 2. Nat Genet 23: 185–188, 1999. - PubMed
-
- Armstrong DD. Neuropathology of Rett syndrome. Ment Retard Dev Disabilities Res Rev 8: 72–76, 2002. - PubMed
-
- Asaka Y, Jugloff DG, Zhang L, Eubanks JH, Fitzsimonds RM. Hippocampal synaptic plasticity is impaired in the Mecp2-null mouse model of Rett syndrome. Neurobiol Dis 21: 217–227, 2006. - PubMed
Publication types
MeSH terms
Substances
Grants and funding
LinkOut - more resources
Full Text Sources
Molecular Biology Databases
Research Materials