Down-regulation of PROS1 gene expression by 17beta-estradiol via estrogen receptor alpha (ERalpha)-Sp1 interaction recruiting receptor-interacting protein 140 and the corepressor-HDAC3 complex
- PMID: 20200160
- PMCID: PMC2859504
- DOI: 10.1074/jbc.M109.062430
Down-regulation of PROS1 gene expression by 17beta-estradiol via estrogen receptor alpha (ERalpha)-Sp1 interaction recruiting receptor-interacting protein 140 and the corepressor-HDAC3 complex
Abstract
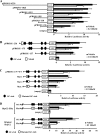
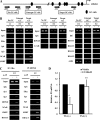
Pregnant women show a low level of protein S (PS) in plasma, which is known to be a risk for deep venous thrombosis. 17Beta-estradiol (E(2)), an estrogen that increases in concentration in the late stages of pregnancy, regulates the expression of various genes via the estrogen receptor (ER). Here, we investigated the molecular mechanisms behind the reduction in PS levels caused by E(2) in HepG2-ERalpha cells, which stably express ERalpha, and also the genomic ER signaling pathway, which modulates the ligand-dependent repression of the PSalpha gene (PROS1). We observed that E(2) repressed the production of mRNA and antigen of PS. A luciferase reporter assay revealed that E(2) down-regulated PROS1 promoter activity and that this E(2)-dependent repression disappeared upon the deletion or mutation of two adjacent GC-rich motifs in the promoter. An electrophoretic mobility shift assay and DNA pulldown assay revealed that the GC-rich motifs were associated with Sp1, Sp3, and ERalpha. In a chromatin immunoprecipitation assay, we found ERalpha-Sp protein-promoter interaction involved in the E(2)-dependent repression of PROS1 transcription. Furthermore, we demonstrated that E(2) treatment recruited RIP140 and the NCoR-SMRT-HDAC3 complex to the PROS1 promoter, which hypoacetylated chromatin. Taken together, this suggested that E(2) might repress PROS1 transcription depending upon ERalpha-Sp1 recruiting transcriptional repressors in HepG2-ERalpha cells and, consequently, that high levels of E(2) leading to reduced levels of plasma PS would be a risk for deep venous thrombosis in pregnant women.
Figures


Similar articles
-
Vascular endothelial growth factor receptor-2 expression is down-regulated by 17beta-estradiol in MCF-7 breast cancer cells by estrogen receptor alpha/Sp proteins.Mol Endocrinol. 2008 Feb;22(2):388-402. doi: 10.1210/me.2007-0319. Epub 2007 Nov 15. Mol Endocrinol. 2008. PMID: 18006642 Free PMC article.
-
A novel estradiol/estrogen receptor alpha-dependent transcriptional mechanism controls expression of the human prolactin receptor.J Biol Chem. 2006 Jul 7;281(27):18825-36. doi: 10.1074/jbc.M512826200. Epub 2006 May 1. J Biol Chem. 2006. PMID: 16651265
-
Kruppel-like factor 9 is a negative regulator of ligand-dependent estrogen receptor alpha signaling in Ishikawa endometrial adenocarcinoma cells.Mol Endocrinol. 2007 Dec;21(12):2988-3001. doi: 10.1210/me.2007-0242. Epub 2007 Aug 23. Mol Endocrinol. 2007. PMID: 17717078
-
Non-classical genomic estrogen receptor (ER)/specificity protein and ER/activating protein-1 signaling pathways.J Mol Endocrinol. 2008 Nov;41(5):263-75. doi: 10.1677/JME-08-0103. Epub 2008 Sep 4. J Mol Endocrinol. 2008. PMID: 18772268 Free PMC article. Review.
-
Nuclear hormone receptor co-repressors: structure and function.Mol Cell Endocrinol. 2012 Jan 30;348(2):440-9. doi: 10.1016/j.mce.2011.08.033. Epub 2011 Sep 8. Mol Cell Endocrinol. 2012. PMID: 21925568 Free PMC article. Review.
Cited by
-
Thromboembolism Triggered by a Combination of Electronic Cigarettes and Oral Contraceptives: A Case Report and Review of Literature.J Investig Med High Impact Case Rep. 2023 Jan-Dec;11:23247096231181072. doi: 10.1177/23247096231181072. J Investig Med High Impact Case Rep. 2023. PMID: 37314028 Free PMC article. Review.
-
Vorinostat induces apoptosis and differentiation in myeloid malignancies: genetic and molecular mechanisms.PLoS One. 2013;8(1):e53766. doi: 10.1371/journal.pone.0053766. Epub 2013 Jan 8. PLoS One. 2013. PMID: 23320102 Free PMC article.
-
Polyamine Oxidase Expression Is Downregulated by 17β-Estradiol via Estrogen Receptor 2 in Human MCF-7 Breast Cancer Cells.Int J Mol Sci. 2022 Jul 7;23(14):7521. doi: 10.3390/ijms23147521. Int J Mol Sci. 2022. PMID: 35886868 Free PMC article.
-
Association of plasma levels of Protein S with disease severity in multiple sclerosis.Mult Scler J Exp Transl Clin. 2015 Jul 24;1:2055217315596532. doi: 10.1177/2055217315596532. eCollection 2015 Jan-Dec. Mult Scler J Exp Transl Clin. 2015. PMID: 28607700 Free PMC article.
-
Pulmonary embolism in a healthy woman using the oral contraceptives containing desogestrel.Obstet Gynecol Sci. 2017 Mar;60(2):232-235. doi: 10.5468/ogs.2017.60.2.232. Epub 2017 Mar 16. Obstet Gynecol Sci. 2017. PMID: 28344968 Free PMC article.
References
-
- Dahlbäck B. (1991) Thromb. Haemost. 66, 49–61 - PubMed
-
- Heeb M. J., Mesters R. M., Tans G., Rosing J., Griffin J. H. (1993) J. Biol. Chem. 268, 2872–2877 - PubMed
-
- Schwarz H. P., Fischer M., Hopmeier P., Batard M. A., Griffin J. H. (1984) Blood 64, 1297–1300 - PubMed
-
- Engesser L., Broekmans A. W., Briët E., Brommer E. J., Bertina R. M. (1987) Ann. Intern. Med. 106, 677–682 - PubMed
Publication types
MeSH terms
Substances
LinkOut - more resources
Full Text Sources
Research Materials
Miscellaneous

