Aggregation of Streptococcus pneumoniae by a pneumococcal capsular polysaccharide-specific human monoclonal IgM correlates with antibody efficacy in vivo
- PMID: 20200186
- PMCID: PMC2863372
- DOI: 10.1128/CVI.00410-09
Aggregation of Streptococcus pneumoniae by a pneumococcal capsular polysaccharide-specific human monoclonal IgM correlates with antibody efficacy in vivo
Abstract
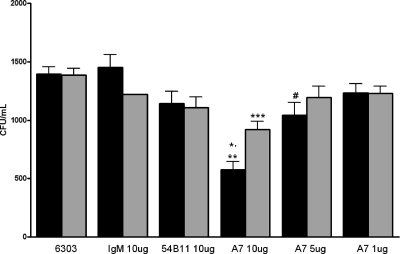
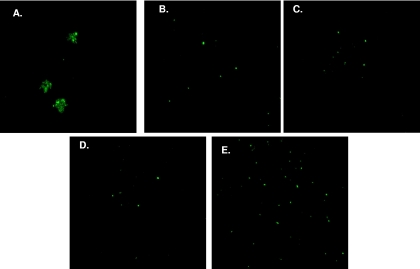
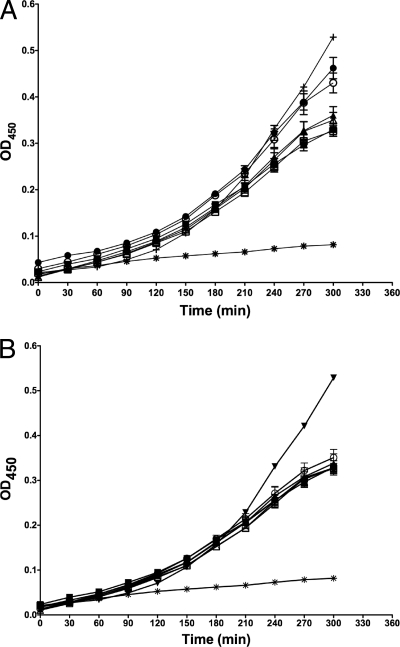
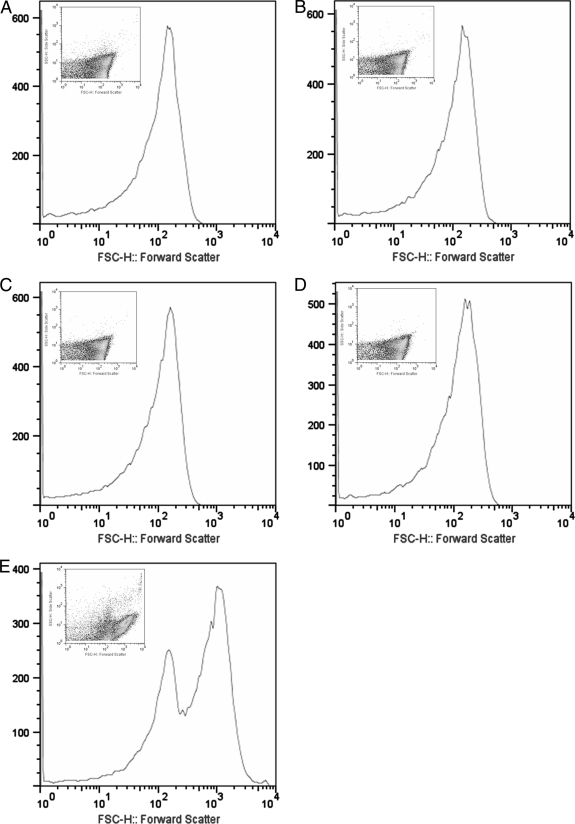
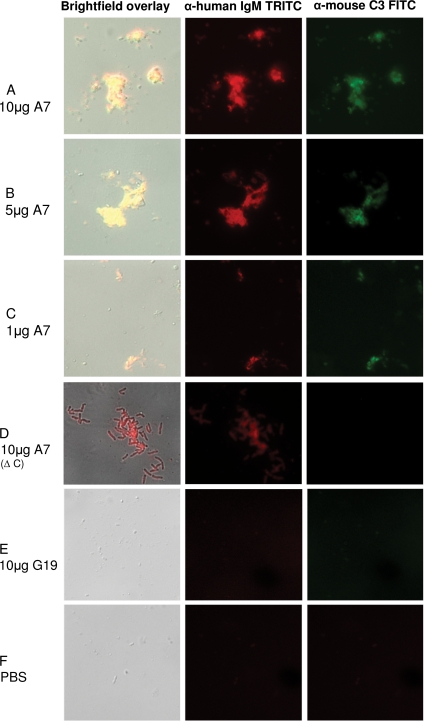
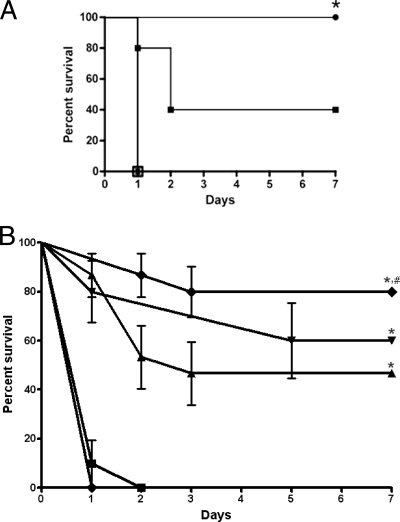
Acquired antibody immunity to Streptococcus pneumoniae (pneumococcus) has been linked to serotype (ST)-specific opsonic antibodies to the relevant pneumococcal capsular polysaccharide (PPS) that mediate protection by enhancing the bactericidal effect of host phagocytes. Despite the well-recognized role of opsonic IgG in host defense against pneumococcus, PPS-specific monoclonal antibodies (MAbs) that mediate protection against lethal challenge with ST3 pneumococcus in mice but do not promote phagocytic killing in vitro (nonopsonic antibodies) have been described. In this study, we sought to determine the biological activity of one such MAb, A7 (a human PPS3-specific IgM), and the mechanism by which it mediates protection. In vitro studies demonstrated that coincubation of A7 with ST3 in the absence of phagocytes or a complement source resulted in a reduction in CFU on blood agar plates that was largely reversible by sonication. A chromogenic cellular proliferation assay demonstrated that A7 did not affect replication of ST3 in liquid culture. The ability of A7 to induce aggregation of ST3 was confirmed by fluorescence microscopy and flow cytometry: A7 induced aggregation of ST3, and in the presence of a complement source, A7 promoted deposition of complement component 3 (C3) on aggregated bacteria in a dose-dependent fashion. Similarly, administration of preincubated mixtures of A7 and ST3 intraperitoneally to mice protected them from the lethality of ST3 in a dose-dependent fashion. These findings suggest that A7-mediated aggregation enhances resistance to ST3, most likely by enhancing C3 deposition on the ST3 capsule, thereby promoting host antipneumococcal activity in vivo.
Figures
Similar articles
-
Reduction of Streptococcus pneumoniae Colonization and Dissemination by a Nonopsonic Capsular Polysaccharide Antibody.mBio. 2016 Feb 2;7(1):e02260-15. doi: 10.1128/mBio.02260-15. mBio. 2016. PMID: 26838726 Free PMC article.
-
The efficacy of pneumococcal capsular polysaccharide-specific antibodies to serotype 3 Streptococcus pneumoniae requires macrophages.Vaccine. 2010 Nov 3;28(47):7542-50. doi: 10.1016/j.vaccine.2010.08.061. Epub 2010 Aug 26. Vaccine. 2010. PMID: 20800700 Free PMC article.
-
Isolation and Characterization of Human Monoclonal Antibodies to Pneumococcal Capsular Polysaccharide 3.Microbiol Spectr. 2021 Dec 22;9(3):e0144621. doi: 10.1128/Spectrum.01446-21. Epub 2021 Nov 10. Microbiol Spectr. 2021. PMID: 34756090 Free PMC article.
-
A Capsular Polysaccharide-Specific Antibody Alters Streptococcus pneumoniae Gene Expression during Nasopharyngeal Colonization of Mice.Infect Immun. 2018 Jun 21;86(7):e00300-18. doi: 10.1128/IAI.00300-18. Print 2018 Jul. Infect Immun. 2018. PMID: 29735523 Free PMC article.
-
Antibody recognition of bacterial surfaces and extracellular polysaccharides.Curr Opin Struct Biol. 2020 Jun;62:48-55. doi: 10.1016/j.sbi.2019.12.001. Epub 2019 Dec 23. Curr Opin Struct Biol. 2020. PMID: 31874385 Review.
Cited by
-
Current concepts in host-microbe interaction leading to pneumococcal pneumonia.Curr Opin Infect Dis. 2013 Jun;26(3):277-83. doi: 10.1097/QCO.0b013e3283608419. Curr Opin Infect Dis. 2013. PMID: 23571695 Free PMC article. Review.
-
The Einstein-Brazil Fogarty: A decade of synergy.Braz J Microbiol. 2015 Oct-Dec;46(4):945-55. doi: 10.1590/S1517-838246420140975. Braz J Microbiol. 2015. PMID: 26691452 Free PMC article. Review.
-
Development of an Efficacious, Semisynthetic Glycoconjugate Vaccine Candidate against Streptococcus pneumoniae Serotype 1.ACS Cent Sci. 2018 Mar 28;4(3):357-361. doi: 10.1021/acscentsci.7b00504. Epub 2018 Mar 14. ACS Cent Sci. 2018. PMID: 29632881 Free PMC article.
-
Vaccine candidates PhtD and PhtE of Streptococcus pneumoniae are adhesins that elicit functional antibodies in humans.Vaccine. 2012 Apr 16;30(18):2900-7. doi: 10.1016/j.vaccine.2012.02.023. Epub 2012 Feb 17. Vaccine. 2012. PMID: 22349524 Free PMC article.
-
Reduction of Streptococcus pneumoniae Colonization and Dissemination by a Nonopsonic Capsular Polysaccharide Antibody.mBio. 2016 Feb 2;7(1):e02260-15. doi: 10.1128/mBio.02260-15. mBio. 2016. PMID: 26838726 Free PMC article.
References
-
- Anonymous. 2008. Progress in introduction of pneumococcal conjugate vaccine—worldwide, 2000-2008. MMWR Morb. Mortal. Wkly. Rep. 57:1148-1151. - PubMed
-
- Baumgarth, N., J. W. Tung, and L. A. Herzenberg. 2005. Inherent specificities in natural antibodies: a key to immune defense against pathogen invasion. Springer Semin. Immunopathol. 26:347-362. - PubMed
-
- Brown, E. J., S. W. Hosea, and M. M. Frank. 1983. The role of antibody and complement in the reticuloendothelial clearance of pneumococci from the bloodstream. Rev. Infect. Dis. 5(Suppl. 4):S797-S805. - PubMed
Publication types
MeSH terms
Substances
Grants and funding
LinkOut - more resources
Full Text Sources
Molecular Biology Databases
Miscellaneous