. 2010 Jun;17(6):910-8.
doi: 10.1128/CVI.00492-09. Epub 2010 Mar 3.

Quality monitoring of HIV-1-infected and uninfected peripheral blood mononuclear cell samples in a resource-limited setting

Affiliations

Quality monitoring of HIV-1-infected and uninfected peripheral blood mononuclear cell samples in a resource-limited setting

Robert E Olemukan et al. Clin Vaccine Immunol. 2010 Jun.

Abstract

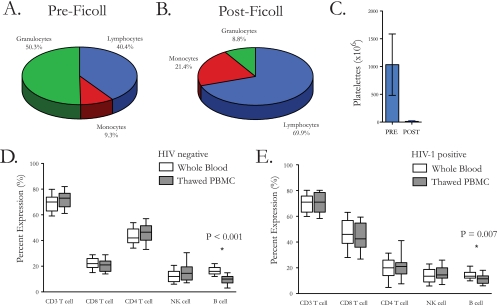
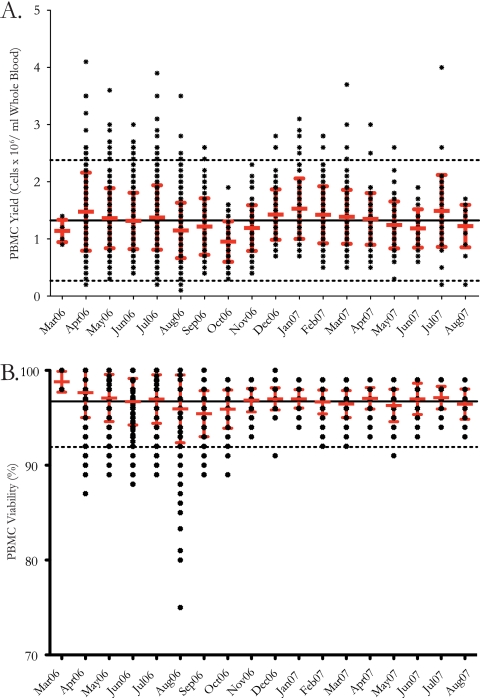
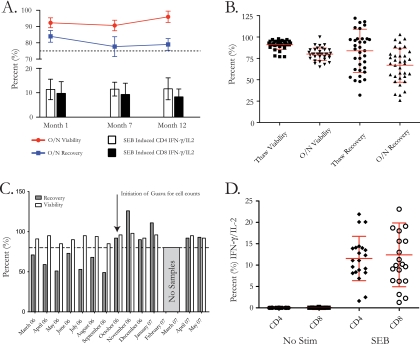
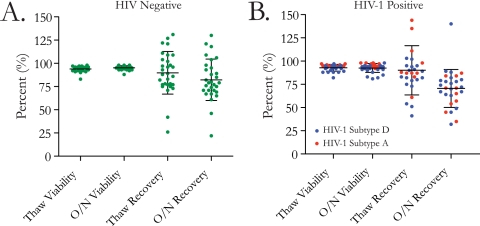
Human immunodeficiency virus type 1 (HIV-1) vaccine and natural history studies are critically dependent on the ability to isolate, cryopreserve, and thaw peripheral blood mononuclear cell (PBMC) samples with a high level of quality and reproducibility. Here we characterize the yield, viability, phenotype, and function of PBMC from HIV-1-infected and uninfected Ugandans and describe measures to ascertain reproducibility and sample quality at the sites that perform cryopreservation. We have developed a comprehensive internal quality control program to monitor processing, including components of method validation. Quality indicators for real-time performance assessment included the time from venipuncture to cryopreservation, time for PBMC processing, yield of PBMC from whole blood, and viability of the PBMC before cryopreservation. Immune phenotype analysis indicated lowered B-cell frequencies following processing and cryopreservation for both HIV-1-infected and uninfected subjects (P < 0.007), but all other major lymphocyte subsets were unchanged. Long-term cryopreservation did not impact function, as unstimulated specimens exhibited low background and all specimens responded to staphylococcal enterotoxin B (SEB) by gamma interferon and interleukin-2 production, as measured by intracellular cytokine staining. Samples stored for more than 3 years did not decay with regard to yield or viability, regardless of HIV-1 infection status. These results demonstrate that it is possible to achieve the high level of quality necessary for vaccine trials and natural history studies in a resource-limited setting and provide strategies for laboratories to monitor PBMC processing performance.


Figures

FIG. 1.
FIG. 1.
PBMC were isolated from whole blood by use of Leucosep tubes, and the quality of the procedure was assessed. (A) Pie chart showing mean (range) proportions of granulocytes (50.3% [28.4% to 78.9%]), lymphocytes (40.4% [17.0% to 58.7%]), and monocytes (9.3% [2.0% to 42.5%]) from 52 whole-blood samples before processing. (B) Pie chart showing mean (range) proportions of granulocytes (8.8% [1.2% to 45.8%]), lymphocytes (69.9% [29.4% to 92.6%]), and monocytes (21.4% [4.9% to 56.3%]) from 52 samples after PBMC processing. (C) Bar chart showing the mean concentration of platelets (106) in whole blood (1,034 [35 to 223]) or after processing (12 [0 to 100]). The effect of processing and cryopreservation on the immune phenotype was assessed and compared to peripheral blood concentrations. (D) Box and whisker plots showing the median and 10th and 90th percentiles for major immune cell subsets in 40 normal healthy individuals. A statistically significant difference was observed for the percentage of B cells (P < 0.001). (E) Box and whisker plots showing the median and 10th and 90th percentiles for major immune cell subsets in 28 HIV-1-positive individuals. A statistically significant decrease was observed for the percentage of B cells (P = 0.007).
FIG. 2.
FIG. 2.
Quality indicators were measured for PBMC processing conducted during a phase I/II clinical trial from March 2006 through August 2007 (n = 2,310). PBMC were received in the laboratory, processed using Leucosep tubes, and cryopreserved in liquid nitrogen vapor. (A) Aligned dot plot showing the mean and standard deviation for PBMC yield (cells [106] per ml of whole blood processed) for samples processed each month over the conduct of the clinical trial. The mean for all samples processed is shown with a solid line, and the level of 2 standard deviations is shown with dotted lines. (B) Aligned dot plot showing the mean and standard deviation for PBMC percent viability after processing of samples each month over the conduct of the clinical trial. The mean for all samples processed is shown with a solid line, and the level of 2 standard deviations is shown with a dotted line.
FIG. 3.
FIG. 3.
The Makerere University Walter Reed Project laboratory follows standard procedures for assessing quality of PBMC collected and cryopreserved during protocol vaccine trials, including internal assessment of longevity, precision, and functionality. (A) PBMC from 3 subjects were assessed for the impact of cryopreservation on recovery, viability, and functionality by thawing the same samples at 1, 7, and 12 months postcryopreservation. The bar and line charts show the means and standard deviations for overnight viability (red), overnight recovery (blue), and control positive responses (IFN-γ/IL-2) to SEB for CD4 (white bars) and CD8 (black bars) cells. (B) Thirty-five samples were processed, cryopreserved (for approximately 1 month), thawed, and assessed for recovery and viability after thawing and overnight rest as part of a monthly internal quality assurance procedure. The scatter plot shows the cumulative mean and standard deviation for all 35 samples. (C) Bar chart showing the mean and standard deviation for thaw recovery and viability for the 35 samples monitored, by month (no samples were processed in February and March 2007). (D) Thirty-five samples were thawed and assessed for function after thaw and overnight rest in response to SEB or in the absence of stimulation. The scatter plot shows the cumulative mean and standard deviation for all 35 samples for CD4 T cells and CD8 T cells.
FIG. 4.
FIG. 4.
The effect of long-term cryopreservation (storage for >3 years) was assessed for HIV-infected and uninfected individuals. (A) Scatter plot showing the cumulative mean and standard deviation for recovery and viability after thaw and overnight (O/N) rest for 30 uninfected samples. (B) Scatter plot showing the cumulative mean and standard deviation for recovery and viability after thaw and overnight rest for 59 HIV-1-infected samples with HIV-1 subtype A (n = 10) (red) and HIV-1 subtype D (n = 19) (blue).

References

    1. Allsopp, C. E., S. J. Nicholls, and J. Langhorne. 1998. A flow cytometric method to assess antigen-specific proliferative responses of different subpopulations of fresh and cryopreserved human peripheral blood mononuclear cells. J. Immunol. Methods 214:175-186. - PubMed
    1. Appay, V., S. Reynard, V. Voelter, P. Romero, D. E. Speiser, and S. Leyvraz. 2006. Immuno-monitoring of CD8+ T cells in whole blood versus PBMC samples. J. Immunol. Methods 309:192-199. - PubMed
    1. Arroyo, M. A., W. B. Sateren, D. Serwadda, R. H. Gray, M. J. Wawer, N. K. Sewankambo, N. Kiwanuka, G. Kigozi, F. Wabwire-Mangen, M. Eller, L. A. Eller, D. L. Birx, M. L. Robb, and F. E. McCutchan. 2006. Higher HIV-1 incidence and genetic complexity along main roads in Rakai District, Uganda. J. Acquir. Immune Defic. Syndr. 43:440-445. - PubMed
    1. Ashmore, L. M., G. M. Shopp, and B. S. Edwards. 1989. Lymphocyte subset analysis by flow cytometry. Comparison of three different staining techniques and effects of blood storage. J. Immunol. Methods 118:209-215. - PubMed
    1. Baker, C. A., K. McEvers, R. Byaruhanga, R. Mulindwa, D. Atwine, J. Nantiba, N. G. Jones, I. Ssewanyana, and H. Cao. 2008. HIV subtypes induce distinct profiles of HIV-specific CD8(+) T cell responses. AIDS Res. Hum. Retroviruses 24:283-287. - PubMed

Publication types

LinkOut - more resources