. 2010 Jun;298(6):C1560-71.
doi: 10.1152/ajpcell.00506.2009. Epub 2010 Mar 3.

Interleukin-7 mediates glucose utilization in lymphocytes through transcriptional regulation of the hexokinase II gene

Affiliations

Interleukin-7 mediates glucose utilization in lymphocytes through transcriptional regulation of the hexokinase II gene

Mounir Chehtane et al. Am J Physiol Cell Physiol. 2010 Jun.

Abstract

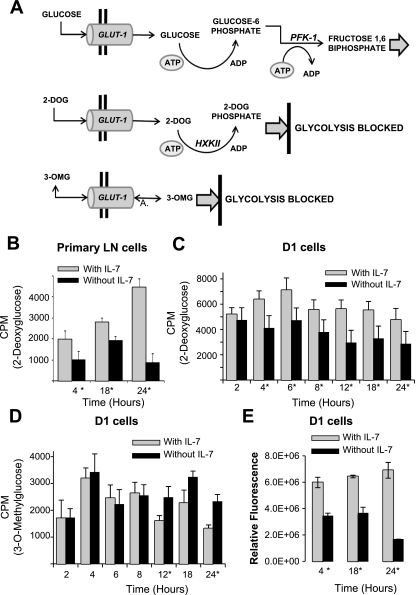
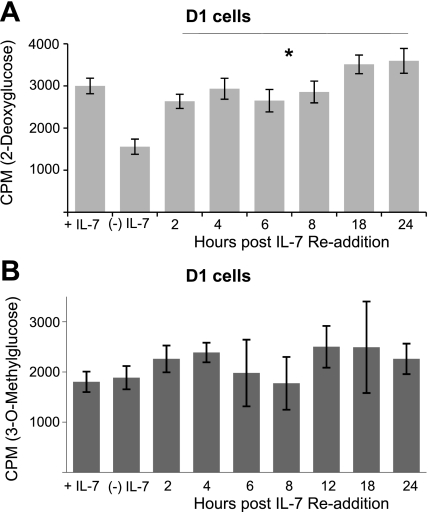
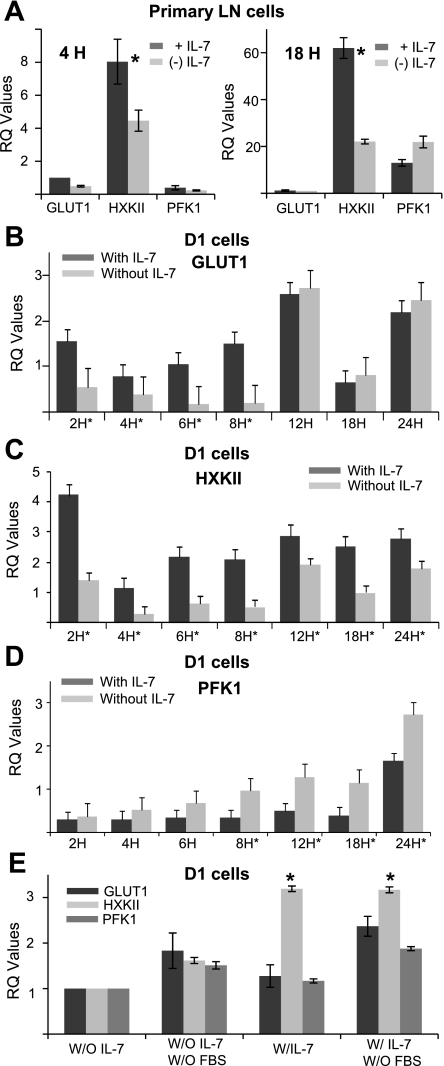
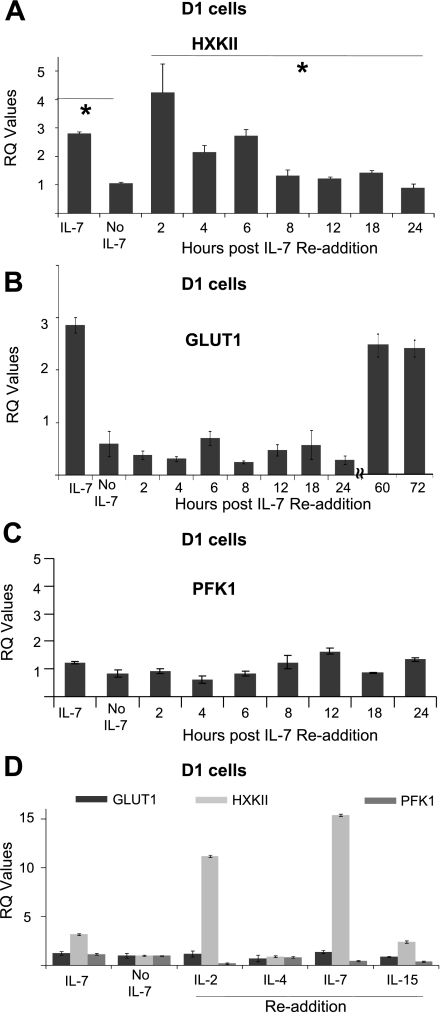
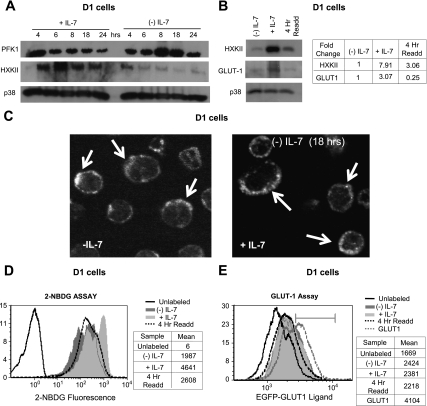
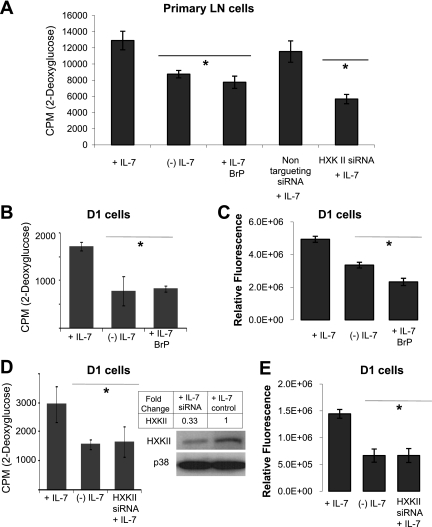
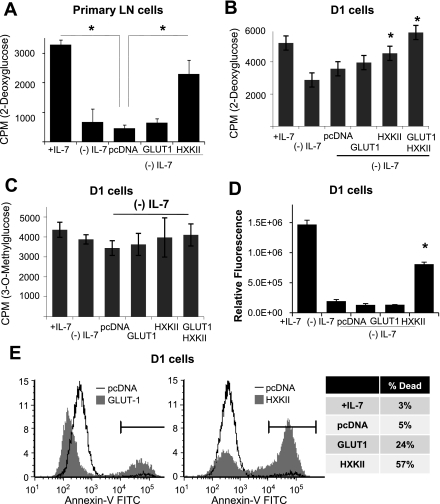
The cytokine interleukin-7 (IL-7) has essential growth activities that maintain the homeostatic balance of the immune system. Little is known of the mechanism by which IL-7 signaling regulates metabolic activity in support of its vital function in lymphocytes. We observed that IL-7 deprivation caused a rapid decline in the metabolism of glucose that was attributable to loss of intracellular glucose retention. To identify the transducer of the IL-7 metabolic signal, we examined the expression of three important regulators of glucose metabolism, the glucose transporter GLUT-1 and two glycolytic enzymes, hexokinase II (HXKII) and phosphofructokinase-1 (PFK-1), using an IL-7-dependent T-cell line and primary lymphocytes. We found that in lymphocytes deprived of IL-7 loss of glucose uptake correlated with decreased expression of HXKII. Readdition of IL-7 to cytokine-deprived lymphocytes restored the transcription of the HXKII gene within 2 h, but not that of GLUT-1 or PFK-1. IL-7-mediated increases in HXKII, but not GLUT-1 or PFK-1, were also observed at the protein level. Inhibition of HXKII with 3-bromopyruvate or specific small-interfering RNA decreased glucose utilization, as well as ATP levels, in the presence of IL-7, whereas overexpression of HXKII, but not GLUT-1, restored glucose retention and increased ATP levels in the absence of IL-7. We conclude that IL-7 controls glucose utilization by regulating the gene expression of HXKII, suggesting a mechanism by which IL-7 supports bioenergetics that control cell fate decisions in lymphocytes.


Figures

Fig. 1.
Fig. 1.
IL-7 signaling controls glucose retention. A: model depicts the pathway by which glucose is imported through the GLUT-1 transporter and metabolized in the first steps of glycolysis by the enzymes hexokinase II (HXKII) and phosphofructokinase-1 (PFK-1). The uptake and metabolism of 2 glucose analogs, [3H]2-deoxyglucose (2-DOG), a glucose molecule that cannot be metabolized but is phosphorylated by HXKII, and [3H]3-O-methlyglucose (3-OMG), a nonmetabolizable glucose molecule that is not phosphorylated by HXKII, are shown. BD: IL-7-cultured murine lymph node (LN) T- cells (B) were incubated with or without 150 ng/ml IL-7 and IL-7 dependent D1 T-cell line (C and D) were incubated with or without IL-7 (50 ng/ml) for the specified periods of time shown in the figures and cells assayed for glucose use with radiolabeled 2-DOG (B and C) or glucose import with radiolabeled 3-OMG (D) as described in materials and methods. E: D1 T cells were cultured with or without IL-7 (50 ng/ml) for 4, 18, and 24 h and total cellular ATP measured using the rLuciferase/Luciferin reagent (Promega) in a luminometer as described in materials and methods. Shown are the values for relative fluorescence that correlate with ATP concentrations. Results are representative of 3 independent experiments performed in triplicate (values are average ± SD). *P < 0.05 compared with w/IL-7 in each time point pair. CPM, counts per minute.
Fig. 2.
Fig. 2.
Restoration of glucose uptake upon IL-7 readdition is dependent on phosphorylation of the hexose. IL-7-dependent D1 T cells were incubated without cytokine for 18 h and IL-7 (50 ng/ml) readded at the time points specified in the figures. Controls included were D1 T cells grown continuously in IL-7 (+IL-7) and D1 T cells deprived of IL-7 for 18 h (−IL-7). D1 T cells were assayed for glucose use with 2-DOG (A) or glucose import with 3-OMG (B) as described in materials and methods. Results are representative of 3 independent experiments performed in triplicate (values are average ± SD). *P < 0.05 compared with cells cultured −IL-7.
Fig. 3.
Fig. 3.
IL-7 regulates gene expression of glycolytic enzymes involved in glucose metabolism. LN T cells or D1 T cells were incubated with or without IL-7 for various time points (as indicated in the figures) and total RNA was extracted and transcribed to cDNA as described in materials and methods. Quantitative PCR (qPCR) was performed to measure the gene expression of GLUT-1, HXKII, and PFK-1. Real-time quantitative (RQ) values were calculated from qPCR data to show relative gene expression as explained in materials and methods. A: murine T cells, isolated from lymph nodes of C57BL/6 mice, were pulsed with (+IL-7) or without (−IL-7) 150 ng/ml of IL-7 for 4 h (left) or cultured with 150 ng/ml of IL-7 for 7 days (+IL-7) and the cytokine withdrawn for 18 h (−IL-7) (right) and RNA extracted for qPCR to measure transcription of GLUT-1, HXKII, and PFK-1 as described above. BD: D1 T cells were cultured with or without 50 ng/ml of IL-7 and RNA extracted for qPCR to measure transcription of GLUT-1 (B), HXKII (C), and PFK-1 (D) as described above. E: D1 T cells were incubated with or without 50 ng/ml of IL-7 in serum-containing or serum-free media for 18 h and gene expression changes for GLUT-1, HXKII and PFK-1 measured as described for BD. Results are representative of at least 3 or more independent experiments. The calibrator sample chosen to determine RQ values was the 18-h time point (BE) without IL-7. The exception to this was A, in which the GLUT-1 gene, 2 h without IL-7, was used as calibrator. *P < 0.05 compared with without IL-7.
Fig. 4.
Fig. 4.
Readdition of IL-7 restores gene expression of HXKII. AC: D1 T cells were deprived of IL-7 for 18 h and washed, and then IL-7 (50 ng/ml) was readded for the periods of time specified in the figures. Total RNA was isolated and transcribed to cDNA as described in materials and methods. qPCR was performed to analyze the gene expression of HXKII (A), GLUT-1 (B), and PFK-1 (C). RQ values were calculated from qPCR data to show relative gene expression as explained in materials and methods. D: D1 T cells were deprived of IL-7 for 18 h then incubated with IL-2, IL-4, IL-7, and IL-15 at an optimal concentration (50 ng/ml) for 2 h. Total RNA was isolated and transcribed to cDNA, and gene expression was analyzed by qPCR as described above. RQ values were calculated from qPCR data to show relative gene expression as explained in materials and methods. The calibrator sample chosen to determine RQ values was the 18-h time point without IL-7. Results are representative of at least 3 independent experiments and values represent average ± SD. *P < 0.05 compared with without IL-7.
Fig. 5.
Fig. 5.
Protein levels of HXKII increase in response to an IL-7 signal. A: D1 T cells were incubated with or without IL-7 (50 ng/ml) for the time points specified in the figure and lysed, and cell lysates were immunoblotted with antibodies against HXKII and PFK-1. p38 MAPK was assayed as control for equal loading. B: IL-7-deprived D1 T cells were incubated with IL-7 (50 ng/ml) for 4 h and then lysed, and protein lysates were immunoblotted for HXKII and GLUT-1 with use of specific antibodies. p38 MAPK was measured to show equal loading. Bands were quantitated using ImageJ software (http://rsbweb.nih.gov/ij/). D1 T cells incubated with or without IL-7 (50 ng/ml) for 18 h were included for comparison. C: D1 T cells were incubated with or without IL-7 (50 ng/ml) for 18 h, washed, then incubated with EGFP-GLUT-1 ligand for 30 min; cells fixed with 4% formaldehyde and attached to slides by cytospin. Results were visualized by confocal microscopy using a Zeiss confocal microscope (LSM520) at ×60. DE: IL-7-deprived D1 T cells were cultured for 4 h with IL-7 (50 ng/ml), washed, and incubated in glucose-free medium and tested for glucose uptake by flow cytometry with fluorescent 2-NBDG (Cflow software, C6 flow cytometer, Accuri) (D), or incubated for 30 min in glucose-free medium with the EGFP-GLUT-1 ligand and tested for GLUT-1 surface expression by flow cytometry (CFlow software, C6 flow cytometer, Accuri) (dotted black lines) (E). Cells cultured with (silver) or without IL-7 (gray) for 18 h are shown as comparison. For the 2-NBDG assay and the EGFP-GLUT-1 ligand data, controls shown are unlabeled, unstimulated cells (solid black lines). As a positive control for measurement of GLUT-1 surface expression, D1-T cells, nucleofected as described in materials and methods with the cDNA for GLUT-1, are also shown (dotted gray line). Marker indicates the percentage of cells transiently expressing high levels of GLUT-1. Data in the tables are the mean peak positions for each sample in the histograms. Controls shown are unlabeled, unstimulated cells (black lines in figures). Data in the tables are the mean peak positions for each sample in the histograms. Shown are representative results of 3 independent experiments performed.
Fig. 6.
Fig. 6.
Inhibition of HXKII decreases glucose uptake and ATP levels independently of IL-7. A: LN T cells were cultured with 150 ng/ml of IL-7 for 7 days and then incubated with or without IL-7 (150 ng/ml) for 18 h and treated with either 3-bromopyruvate (BrP) or the Smart Pool HXKII small interfering RNA (siRNA; Accell) described below. A nontargeting siRNA was used as control. Glucose use was measured by assaying the uptake of 2-DOG as described in materials and methods. B: D1 T cells were incubated with IL-7 (50 ng/ml) or without IL-7 and BrP for 18 h, then assayed for glucose use with 2-DOG as described in materials and methods. C: D1 T cells were incubated with IL-7 (50 ng/ml) or without IL-7 and BrP as in B, and total cellular ATP was measured by using the rLuciferase/Luciferin reagent (Promega) in a luminometer as described in materials and methods. Shown are the values for relative fluorescence that correlate with ATP concentrations. DE: HXKII gene expression was inhibited in D1 T cells using Smart Pool HXKII siRNA (Accell). Knockout of HXKII gene expression with specific HXKII siRNA is shown in the immunoblot for HXKII (D). p38 is included as a loading control. Relative densities of bands in the blot were determined by using ImageJ software. To assess glucose use upon HXKII inhibition, 2-DOG uptake was measured as described in materials and methods. E: total intracellular ATP was measured as described in C. Results are representative of 3 independent experiments performed in triplicate (values are average ± SD). *P < 0.05 compared with cells cultured + IL-7.
Fig. 7.
Fig. 7.
Overexpression of HXKII increases glucose uptake and ATP levels independently of IL-7. A: freshly isolated murine T cells from lymph nodes were nucleofected with either empty vector (pcDNA) or the cDNAs for GLUT-1 or HXKII and glucose use by 2-DOG uptake in the absence of IL-7 measured as described in materials and methods. Cells cultured with IL-7 (+Il-7) are shown as controls. BC: D1 T cells were deprived from IL-7 for 18 h, nucleofected (Amaxa) with cDNAs for GLUT-1, HXKII, or empty vector (pcDNA), then incubated with or without IL-7 (50 ng/ml) for 4–8 h and assayed for glucose use with 2-DOG (A) or glucose import with 3-OMG (B) as described in materials and methods. D: D1 T cells were incubated with IL-7 or without IL-7, and deprived cells were nucleofected with plasmids as described in B. Total cellular ATP was measured by using the rLuciferase/Luciferin reagent (Promega) in a luminometer as described in materials and methods. Shown are the values for relative fluorescence that correlate with ATP concentrations. E: D1 T cells were incubated with or without IL-7 (50 ng/ml) and IL-7-deprived cells were nucleofected with plasmids as described in B. Cell death was assessed by staining with annexin-V-FITC and read by flow cytometry as described in materials and methods. Results are representative of 3 or more independent experiments performed in triplicate (values are average ± SD). *P < 0.05 compared with cells cultured without (−) IL-7.

Similar articles

Cited by

References

    1. Akbar AN, Borthwick NJ, Wickremasinghe RG, Panayoitidis P, Pilling D, Bofill M, Krajewski S, Reed JC, Salmon M. Interleukin-2 receptor common gamma-chain signaling cytokines regulate activated T cell apoptosis in response to growth factor withdrawal: selective induction of anti-apoptotic (bcl-2, bcl-xL) but not pro-apoptotic (bax, bcl-xS) gene expression. Eur J Immunol 26: 294–299, 1996 - PubMed
    1. Azfer A, Niu J, Rogers LM, Adamski FM, Kolattukudy PE. Activation of endoplasmic reticulum stress response during the development of ischemic heart disease. Am J Physiol Heart Circ Physiol 291: H1411–H1420, 2006 - PMC - PubMed
    1. Barata JT, Cardoso AA, Boussiotis VA. Interleukin-7 in T-cell acute lymphoblastic leukemia: an extrinsic factor supporting leukemogenesis? Leuk Lymphoma 46: 483–495, 2005 - PubMed
    1. Barata JT, Silva A, Brandao JG, Nadler LM, Cardoso AA, Boussiotis VA. Activation of PI3K is indispensable for interleukin 7-mediated viability, proliferation, glucose use, and growth of T cell acute lymphoblastic leukemia cells. J Exp Med 200: 659–669, 2004 - PMC - PubMed
    1. Barthel A, Okino ST, Liao J, Nakatani K, Li J, Whitlock JP, Jr, Roth RA. Regulation of GLUT1 gene transcription by the serine/threonine kinase Akt1. J Biol Chem 274: 20281–20286, 1999 - PubMed

Publication types

MeSH terms

LinkOut - more resources