. 2010 Jun;115(2):453-61.
doi: 10.1093/toxsci/kfq067. Epub 2010 Mar 3.

Evaluation of dicarbonyls generated in a simulated indoor air environment using an in vitro exposure system

Affiliations

Evaluation of dicarbonyls generated in a simulated indoor air environment using an in vitro exposure system

Stacey E Anderson et al. Toxicol Sci. 2010 Jun.

Abstract

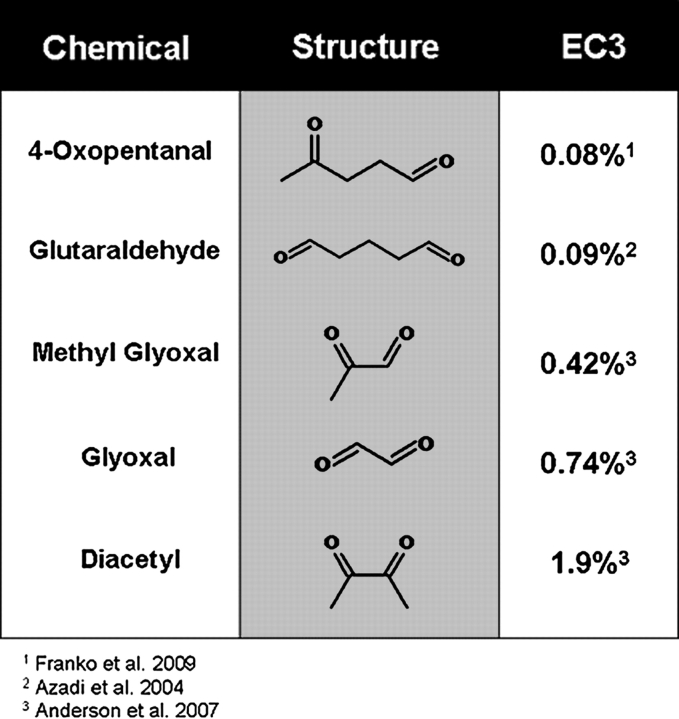
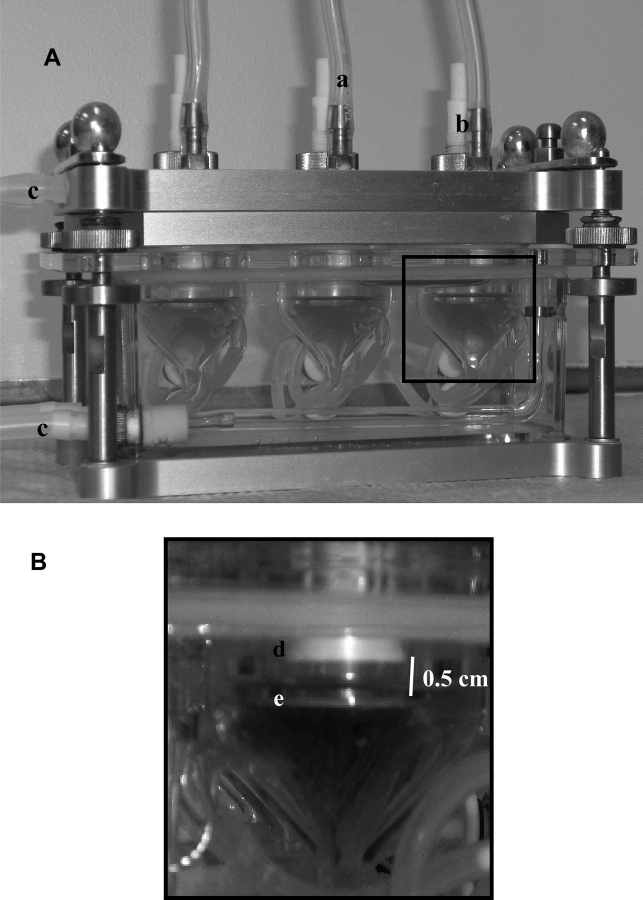
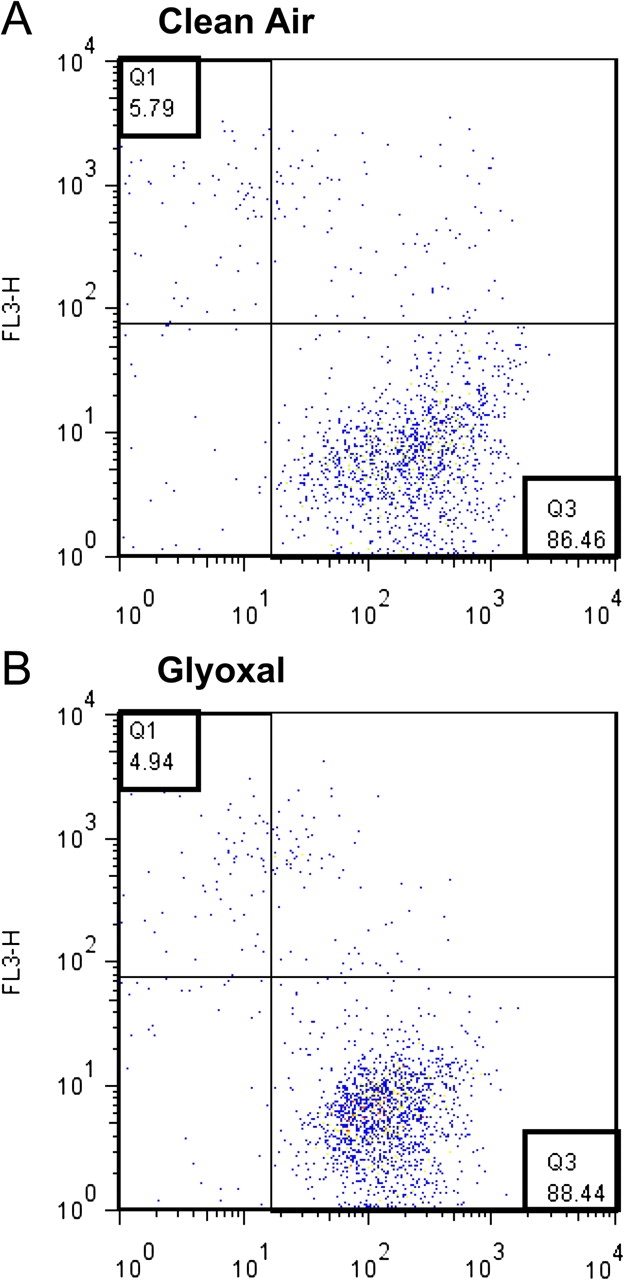
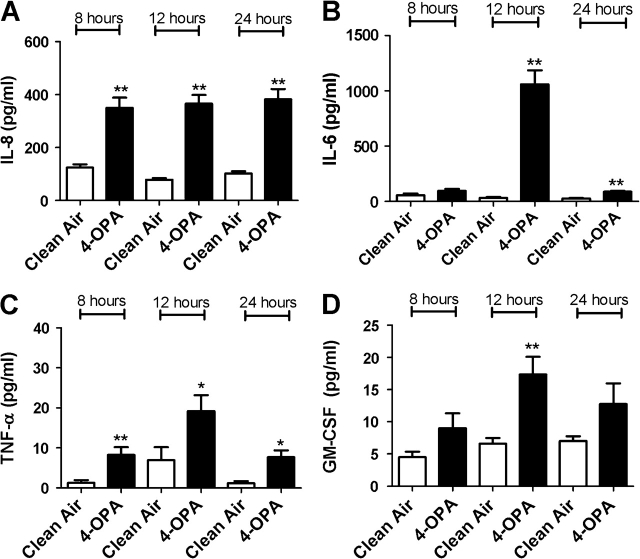
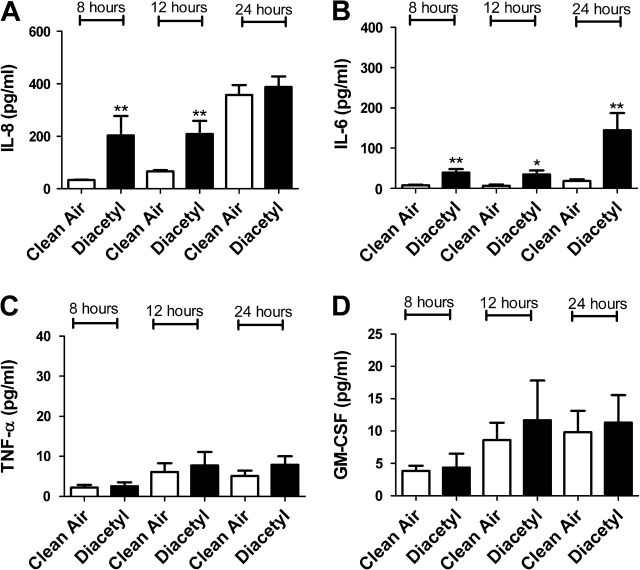
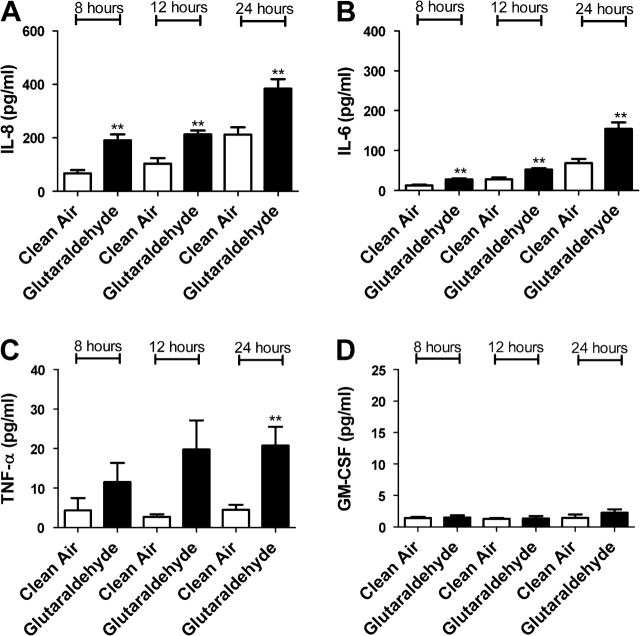
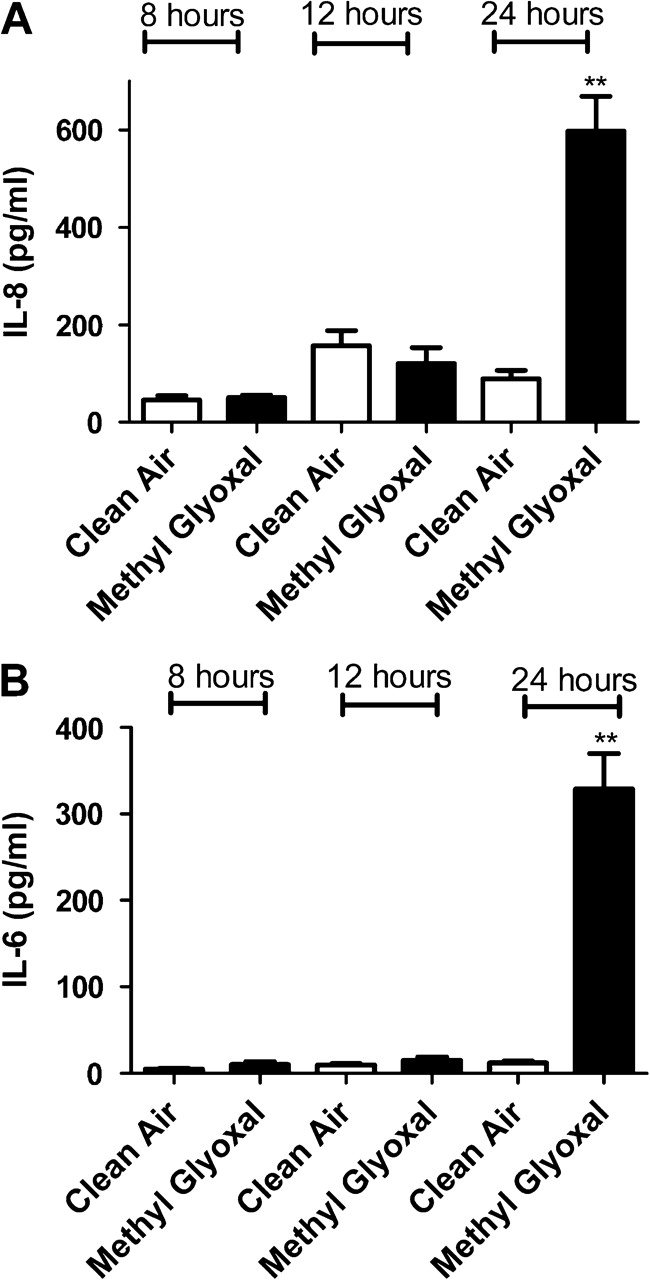
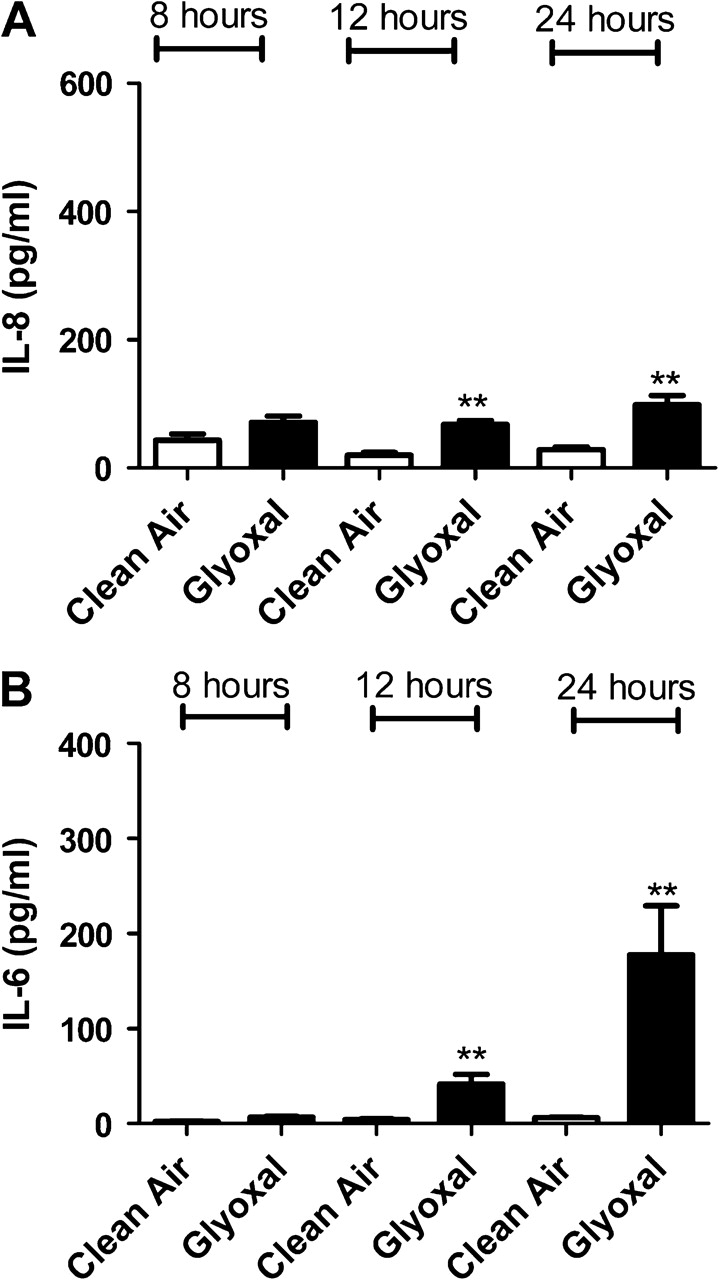
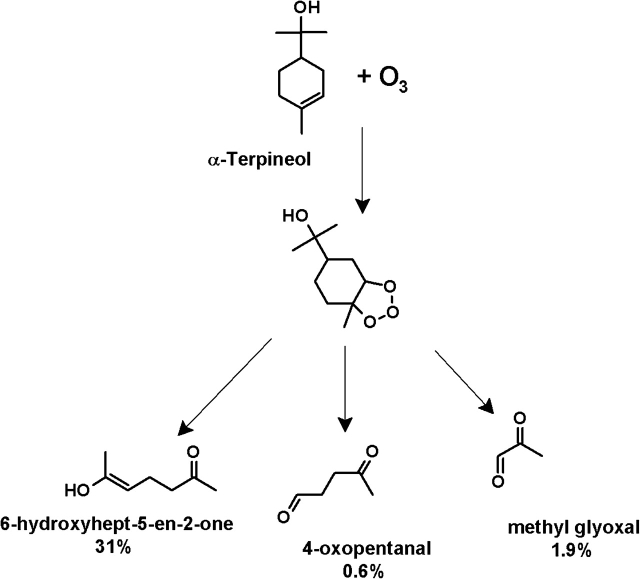
Over the last two decades, there has been increasing awareness regarding the potential impact of indoor air pollution on health. Exposure to volatile organic compounds (VOCs) or oxygenated organic compounds formed from indoor chemistry has been suggested to contribute to adverse health effects. These studies use an in vitro monitoring system called VitroCell, to assess chemicals found in the indoor air environment. The structurally similar dicarbonyls diacetyl, 4-oxopentanal (4-OPA), glyoxal, glutaraldehyde, and methyl glyoxal were selected for use in this system. The VitroCell module was used to determine whether these dicarbonyls were capable of inducing inflammatory cytokine expression by exposed pulmonary epithelial cells (A549). Increases in the relative fold change in messenger RNA expression of the inflammatory mediators, interleukin (IL)-6, IL-8, granulocyte-macrophage colony-stimulating factor (GM-CSF), and tumor necrosis factor alpha (TNF-alpha) were identified following exposure to diacetyl, 4-OPA, glyoxal, glutaraldehyde, and methyl glyoxal when compared to a clean air control. Consistent results were observed when the protein levels of these cytokines were analyzed. Exposure to 4-OPA significantly elevated IL-8, IL-6, GM-CSF, and TNF-alpha while glutaraldehyde caused significant elevations in IL-6, IL-8, and TNF-alpha. IL-6 and IL-8 were also significantly elevated after exposure to diacetyl, glyoxal, and methyl glyoxal. These studies suggest that exposure to structurally similar oxygenated reaction products may be contributing to some of the health effects associated with indoor environments and may provide an in vitro method for identification and characterization of these potential hazards.


Figures

FIG. 1.
FIG. 1.
Chemical structure of evaluated dicarbonyls. Identification of the chemical and structure for each of the dicarbonyls investigated in these experiments. The sensitization potential (EC3; concentration of chemical required to induce a threefold increase in lymphocyte proliferation over control) for each of these chemicals was previously determined.
FIG. 2.
FIG. 2.
VitroCell chambers used for exposures. (A) Representation of VitroCell exposure module. Exposure atmosphere (dicarbonyls and/or reaction products) is pulled across apical surface of the cell though inlets (b) and removed from the chamber by a vacuum pump (a) at a constant flow rate of 5 ml/min for all chambers. Module is kept at a constant temperature of 37°C using a circulating water bath (c) for the duration of the exposures. (B) Enlarged section of box depicted in (A). Test atmosphere is delivered to cells grown on transmembrane insets (e) via trumpets (d). Distance between the trumpet and inserts is 0.5 cm.
FIG. 3.
FIG. 3.
Viability of A549 cells after exposure to glyoxal and clean air. Representative dot plot showing the percent of living and dead cells 24 h after a 4-h clean air (A) or glyoxal (B) VitroCell exposure as determined by flow cytometry. The number in quadrant 1 (Q1) indicates the percent of dead cells and the number in quadrant 3 (Q3) represents the percent of viable cells. Dot plot shows FL1-calcein AM on the x-axis and FL3-ethidium homodimer-1 on y-axis.
FIG. 4.
FIG. 4.
The effect of 4-OPA exposure on concentrations of inflammatory cytokines. Bars represent the mean protein concentration ± SE determined by ELISA present in supernatants of six A549 cell cultures from two independent exposures. Samples were collected at 8, 12, and 24 h after VitroCell exposure and evaluated for IL-8 (A), IL-6 (B), TNF-α (C), and GM-CSF (D) protein levels. Significant differences between dicarbonyl and clean air exposure are designated with **(p ≤ 0.01) or *(p ≤ 0.05).
FIG. 5.
FIG. 5.
The effect of diacetyl exposure on concentrations of inflammatory cytokines. Bars represent the mean protein concentration ± SE determined by ELISA present in supernatants of three A549 cell cultures from two independent exposures. Samples were collected at 8, 12, and 24 h after VitroCell exposure and evaluated for IL-8 (A), IL-6 (B), TNF-α (C), and GM-CSF (D) protein levels. Significant differences between dicarbonyl and clean air exposure are designated with **(p ≤ 0.01) or *(p ≤ 0.05).
FIG. 6.
FIG. 6.
The effect of glutaraldehyde exposure on concentrations of inflammatory cytokines. Bars represent the mean protein concentration ± SE determined by ELISA present in supernatants of three A549 cell cultures from two independent exposures. Samples were collected at 8, 12, and 24 h after VitroCell exposure and evaluated for IL-8 (A), IL-6 (B), TNF-α (C), and GM-CSF (D) protein levels. Significant differences between dicarbonyl and clean air exposure are designated with **(p ≤ 0.01) or *(p ≤ 0.05).
FIG. 7.
FIG. 7.
The effect of methyl glyoxal exposure on concentrations of inflammatory cytokines. Bars represent the mean protein concentration ± SE determined by ELISA present in supernatants of three A549 cell cultures from two independent exposures. Samples were collected at 8, 12, and 24 h after VitroCell exposure and evaluated for IL-8 (A) and IL-6 (B). Significant differences between dicarbonyl and clean air exposure are designated with ** (p ≤ 0.01) or *(p ≤ 0.05).
FIG. 8.
FIG. 8.
The effect of glyoxal exposure on concentrations of inflammatory cytokines. Bars represent the mean protein concentration ± SE determined by ELISA present in supernatants of three A549 cell cultures from two independent exposures. Samples were collected at 8, 12, and 24 h after VitroCell exposure and evaluated for IL-8 (A) and IL-6 (B). Significant differences between dicarbonyl and clean air exposure are designated with **(p ≤ 0.01) or *(p ≤ 0.05).
FIG. 9.
FIG. 9.
α-Terpineol + ozone products and yields. Reaction mechanism for α-terpineol + ozone showing formation and yield (in percentages) of 6-hydroxyhept-5-en-2-one, 4-OPA, and methyl glyoxal.

References

    1. Anderson SE, Wells JR, Fedorowicz A, Butterworth LF, Meade BJ, Munson AE. Evaluation of the contact and respiratory sensitization potential of volatile organic compounds generated by simulated indoor air chemistry. Toxicol. Sci. 2007;97:355–363. - PubMed
    1. Aschmann SM, Tuazon EC, Arey J, Atkinson R. Products of the gas-phase reaction of O-3 with cyclohexene. J. Phys. Chem. 2003;107:2247–2255.
    1. Azadi S, Klink KJ, Meade BJ. Divergent immunological responses following glutaraldehyde exposure. Toxicol. Appl. Pharmacol. 2004;197:1–8. - PubMed
    1. Bakand S, Winder C, Khalil C, Hayes A. A novel in vitro exposure technique for toxicity testing of selected volatile organic compounds. J. Environ. Monit. 2006;8:100–105. - PubMed
    1. Bautista MV, Chen Y, Ivanova VS, Rahimi MK, Watson AM, Rose MC. IL-8 regulates mucin gene expression at the posttranscriptional level in lung epithelial cells. J. Immunol. 2009;183:2159–2166. - PubMed

Publication types

MeSH terms