. 2010 May;84(10):4912-22.
doi: 10.1128/JVI.02486-09. Epub 2010 Mar 3.

Innate immune responses and permissiveness to ranavirus infection of peritoneal leukocytes in the frog Xenopus laevis

Affiliations

Innate immune responses and permissiveness to ranavirus infection of peritoneal leukocytes in the frog Xenopus laevis

Heidi D Morales et al. J Virol. 2010 May.

Abstract

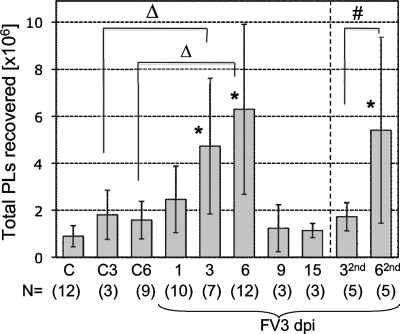
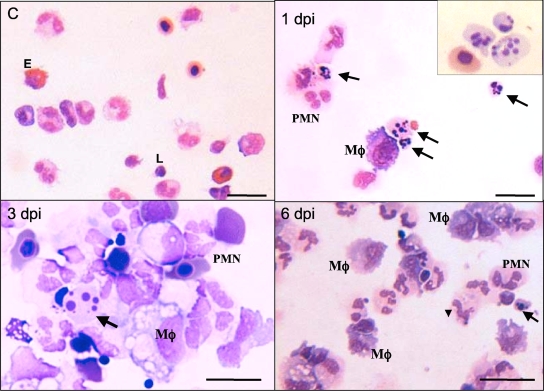
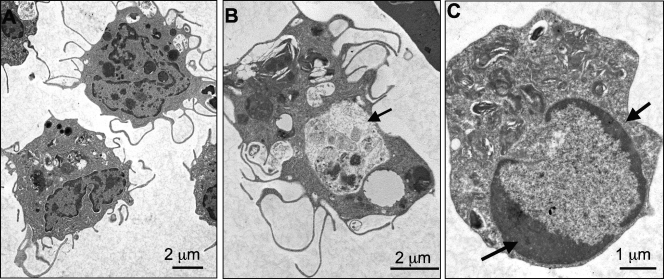
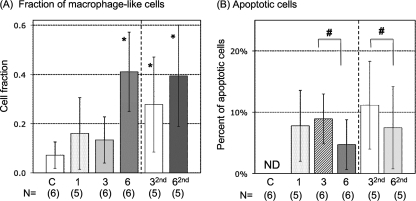
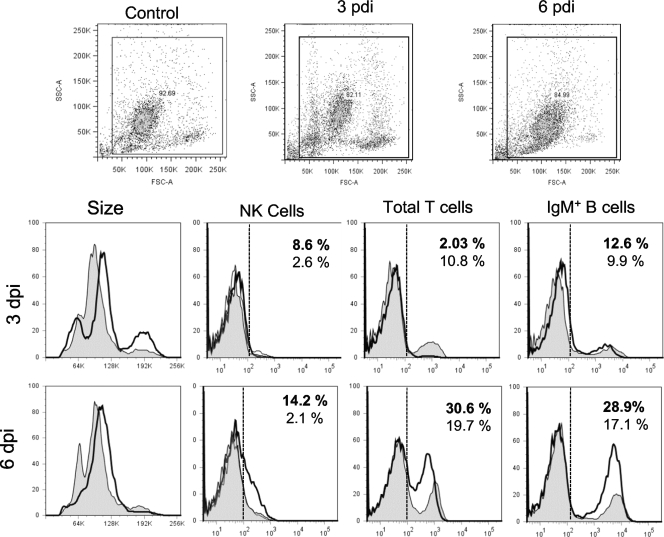
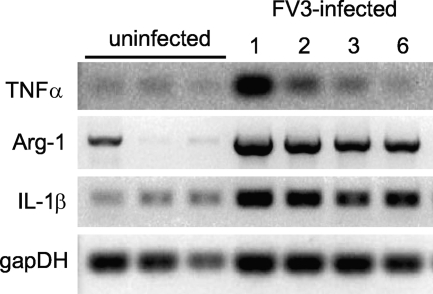
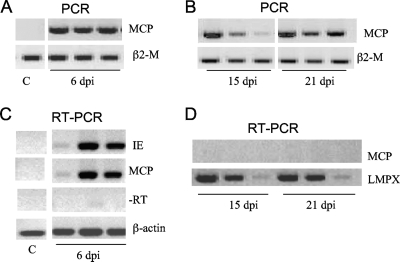
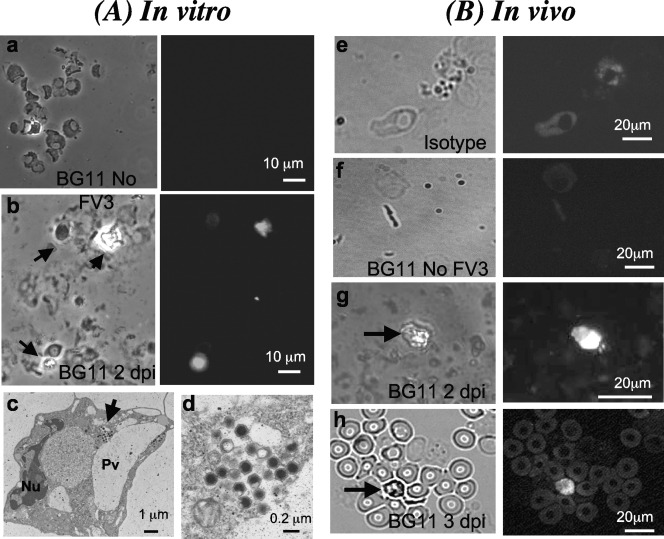
Ranaviruses such as frog virus 3 ([FV3] family Iridoviridae) are increasingly prevalent pathogens that infect reptiles, amphibians, and fish worldwide. Whereas studies in the frog Xenopus laevis have revealed the critical involvement of CD8 T-cell and antibody responses in host resistance to FV3, little is known about the role played by innate immunity to infection with this virus. We have investigated the occurrence, composition, activation status, and permissiveness to infection of peritoneal leukocytes (PLs) in Xenopus adults during FV3 infection by microscopy, flow cytometry, and reverse transcription-PCR. The total number of PLs and the relative fraction of activated mononucleated macrophage-like cells significantly increase as early as 1 day postinfection (dpi), followed by NK cells at 3 dpi, before the peak of the T-cell response at 6 dpi. FV3 infection also induces a rapid upregulation of proinflammatory genes including arginase 1, interleukin-1beta, and tumor necrosis factor alpha. Although PLs are susceptible to FV3 infection, as evidenced by apoptotic cells, active FV3 transcription, and the detection of viral particles by electron microscopy, the infection is weaker (fewer infectious particles), more transitory, and involves a smaller fraction (less than 1%) of PLs than the kidney, the main site of infection. However, viral DNA remains detectable in PLs for at least 3 weeks postinfection, past the point of viral clearance observed in the kidneys. This suggests that although PLs are actively involved in anti-FV3 immune responses, some of these cells can be permissive and harbor quiescent, asymptomatic FV3.


Figures

FIG. 1.
FIG. 1.
Total numbers of PLs recovered by lavage during primary and secondary FV3 infection. Averages ± standard deviations from 3 to 4 independent experiments of PLs collected in a volume of approximately 4 to 5 ml of APBS from 2- to 3-in. naïve frogs infected with 1 × 10⁶ to 5 × 10⁶ PFU of FV3 once for 1 to 15 days or at 1 month prior to the experiment and reinfected for 3 (32nd) and 6 days (62nd). Control animals were injected with saline vehicle for 3 (C3) or 6 (C6) days or uninjected (C). Statistical significance was determined by ANOVA (*, P < 0.01 relative to C; #, P < 0.01 between 32nd and 62nd; Δ, P < 0.05 between C3 and 3; see Materials and Methods for more information) for experimental groups containing more than five animals. Numbers of animals for each group are indicated at the bottom of the graph (N).
FIG. 2.
FIG. 2.
Peritoneal leukocytes from FV3-infected Xenopus adults. Representative images of cytocentrifuged PLs from sham-infected or infected frogs (1 × 10⁶ to 5 × 10⁶ PFU of FV3) for 1, 3, and 6 days. Samples were stained with Giemsa. PMN, polymorphonuclear cells; E, eosinophils, Mφ, macrophages-like cells; L, lymphocytes. The arrows indicate apoptotic bodies. Scale bar, 100 μm.
FIG. 3.
FIG. 3.
Electron micrograph of peritoneal macrophage-like cells from FV3-infected Xenopus adults. PLs were isolated from frogs at 2 days postinfection with 5 × 10⁶ PFU of FV3, processed, and visualized under a Hitachi 7650 TEM. (A) Two mononucleated macrophage-like cells with multiple pseudopods. (B) A macrophage-like cell with a large phagocytic vacuole (arrow). (C) Apoptotic cells showing heterochromatic condensation (arrows).
FIG. 4.
FIG. 4.
Relative fraction of macrophage-like cells and apoptotic cells in the peritoneal cavity during primary and secondary FV3 infection. (A) Proportions of macrophage-like cells (expressed as fractions) of the total cells were determined in each of 10 randomly chosen areas of Giemsa-stained cytospin preparations of PLs (approximately 20 to 40 cells per areas). Animals were infected either once for 1, 3, or 6 days or at 1 month prior to the experiment and reinfected for 3 (32nd) and 6 (62nd) days. Averages ± SDs of 10 areas for 3 to 6 animals (indicated in parentheses) from three to four independent experiments are shown. *, P < 0.01 relative to C at 32nd or 62nd dpi and the other groups (ANOVA). (B) Average percentage of apoptotic cells in each of 10 randomly chosen areas of Giemsa-stained cytospin preparations of PLs for 3 to 6 animals from three to four independent experiments. ND, not detected; #, P < 0.05 by ANOVA. The control group was not included in the statistical analysis since no apoptotic cells were found.
FIG. 5.
FIG. 5.
Lymphocytes and NK cells in PLs of FV3-infected animals. Representative single-color flow cytometry analysis of PLs isolated from uninfected and infected (1 × 10⁶ PFU of FV3) animals at days 1, 3, and 6 postinfection and stained with MAbs specific to Xenopus NK cells (1F8), total CD5 T cells, and IgM+ B cells are shown. Forward and side scatter dot plots (10,000 events collected) with the gates used for the histograms are shown. The percentages of positive cells compared to the isotype control for uninfected (regular fonts) and infected (bold fonts) frogs are indicated. Filled peak, uninfected PLs; solid thick peak, infected PLs; dashed line, limit of signal intensity for 95% of PLs stained with isotype Ab control.
FIG. 6.
FIG. 6.
Expression pattern of proinflammatory genes during FV3 infection. RT-PCR of PLs (1 × 10⁶ cells) isolated from pooled samples of two to three uninfected and infected (1 × 10⁶ PFU FV3) animals at days 1, 2, 3, and 6 postinfection using primers specific for Xenopus TNF-α, arginase 1 (Arg-1), IL-1β, and glyceraldehyde-3-phosphate dehydrogenase (GAPDH) as a housekeeping gene control. Except for GAPDH (25 cycles), 30 cycles were used. No signal was detected with RT-negative controls.
FIG. 7.
FIG. 7.
In vivo FV3 infection and transcription in PLs. PCR analysis (35 cycles) was performed on total DNA (0.5 to 1 μg) from PLs isolated from three animals infected for 6 days (A) or for 15 and 21 days (B) with 1 × 10⁶ PFU of FV3 and using primers specific for the FV3 MCP gene and β2-microglobulin (β2-M) as positive controls. RT-PCR analysis was performed on total mRNA (500 ng) isolated from uninfected or infected PLs at 6 days (C) or at 15 and 21 days (D) postinfection using primers for the MCP and IE genes of FV3 and β-actin or LMPX (large multifunctional protease X) as controls for 30 cycles. Data shown are representative of two experiments. −RT, controls lacking reverse transcriptase.
FIG. 8.
FIG. 8.
Immunofluorescence and TEM analysis of PLs infected in vitro or in vivo with FV3. (A) Representative images of cytocentrifuged PLs obtained from frogs after elicitation with heat-killed bacteria and either mock infected (a) or infected in vitro at an MOI of 3 for 2 days (b). Cells were fixed for 30 s in cold (−20°C) acetone, blocked with serum, and incubated with anti-FV3 BG11 MAb undiluted supernatant, followed by an FITC-conjugated goat anti-mouse Ab preadsorbed on Xenopus cells. Preparations were visualized with a Leica DMIRB inverted fluorescence microscope using a phase-contrast field (left side of frames a and b) or fluorescence (right side of frames a and b). A TEM view of macrophage-like cells infected in vitro is shown in frame c, and the viral capsid in the cytoplasm is shown at higher magnification in frame d. Arrow, viral particle; Nu, nucleus, Pv, phagocytic vesicle. (B) Representative images of cytocentrifuged PLs obtained from sham-infected (e) or infected (5 × 10⁶ PFU of FV3) frogs at 2 days (f) or 3 days (g and h) and processed as described for panel A. Arrows depict positively stained infected cells.

Similar articles

Cited by

References

    1. Chinchar, V. G. 2002. Ranaviruses (family Iridoviridae): emerging cold-blooded killers. Arch. Virol. 147:447-470. - PubMed
    1. Chinchar, V. G., L. Bryan, J. Wang, S. Long, and G. D. Chinchar. 2003. Induction of apoptosis in frog virus 3-infected cells. Virology 306:303-312. - PubMed
    1. Chinchar, V. G., D. W. Metzger, A. Granoff, and R. Goorha. 1984. Localization of frog virus 3 proteins using monoclonal antibodies. Virology 137:211-216. - PubMed
    1. Cunningham, A. A., A. D. Hyatt, P. Russell, and P. M. Bennett. 2007. Emerging epidemic diseases of frogs in Britain are dependent on the source of ranavirus agent and the route of exposure. Epidemiol. Infect. 135:1200-1212. - PMC - PubMed
    1. Daszak, P., L. Berger, A. A. Cunningham, A. D. Hyatt, D. E. Green, and R. Speare. 1999. Emerging infectious diseases and amphibian population declines. Emerg. Infect. Dis. 5:735-748. - PMC - PubMed

Publication types