. 2010 Apr 1;184(7):3789-800.
doi: 10.4049/jimmunol.0903168. Epub 2010 Mar 3.

Carbohydrate oxidation acidifies endosomes, regulating antigen processing and TLR9 signaling

Affiliations

Carbohydrate oxidation acidifies endosomes, regulating antigen processing and TLR9 signaling

Colleen J Lewis et al. J Immunol. .

Abstract

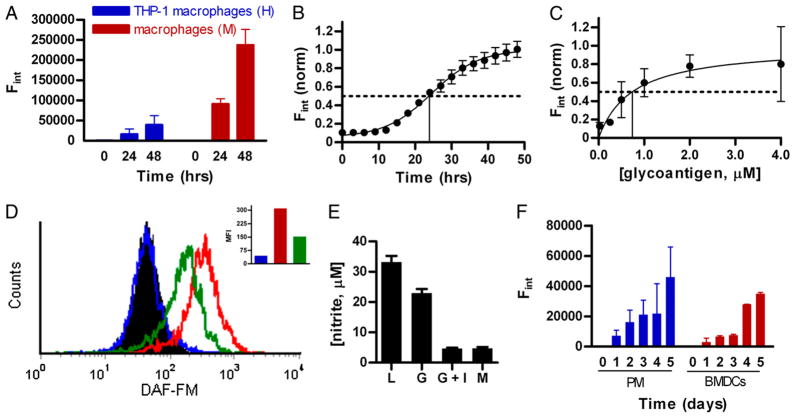
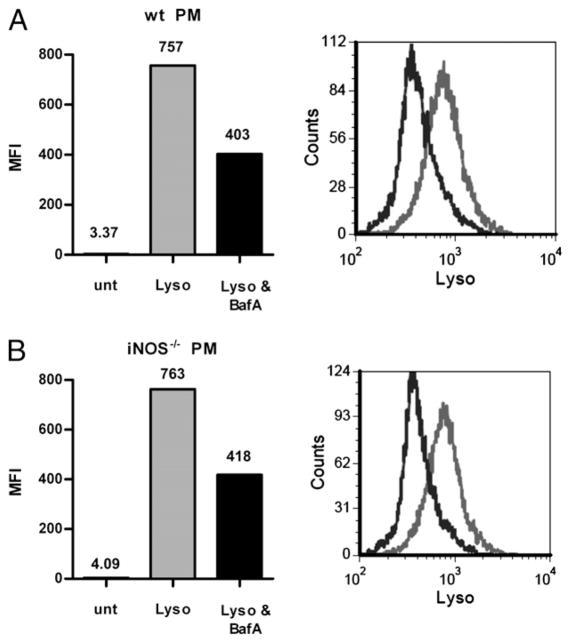
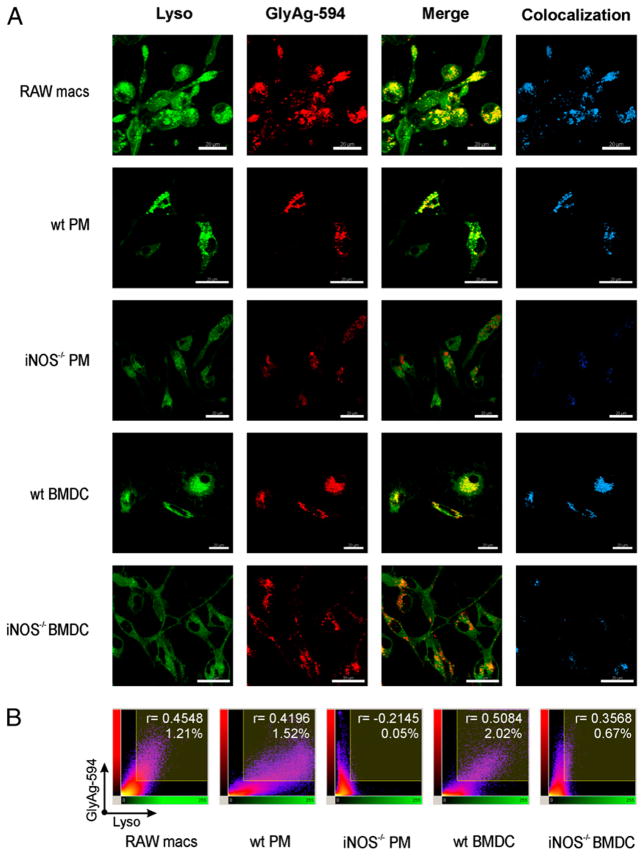
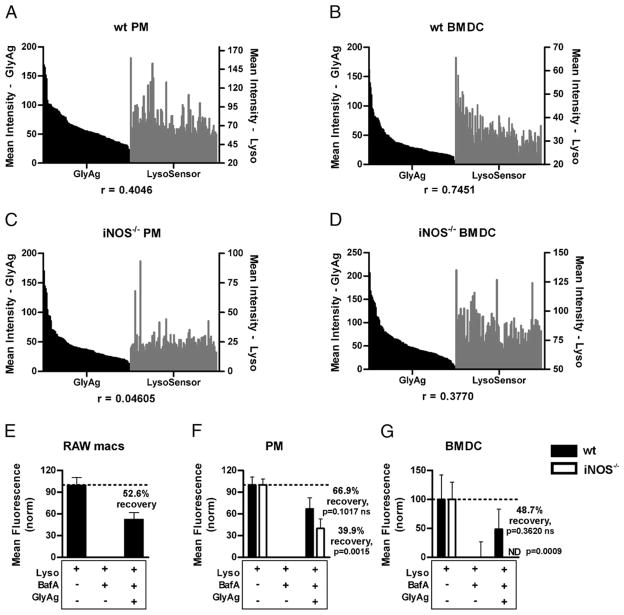
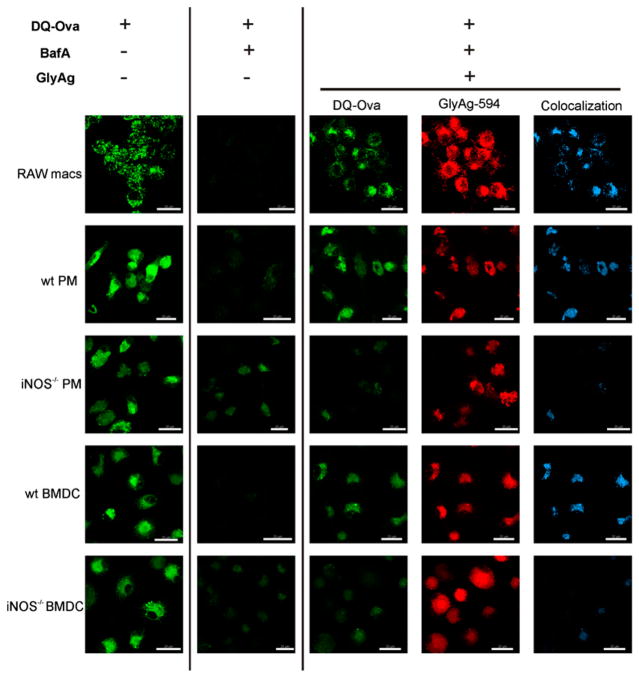
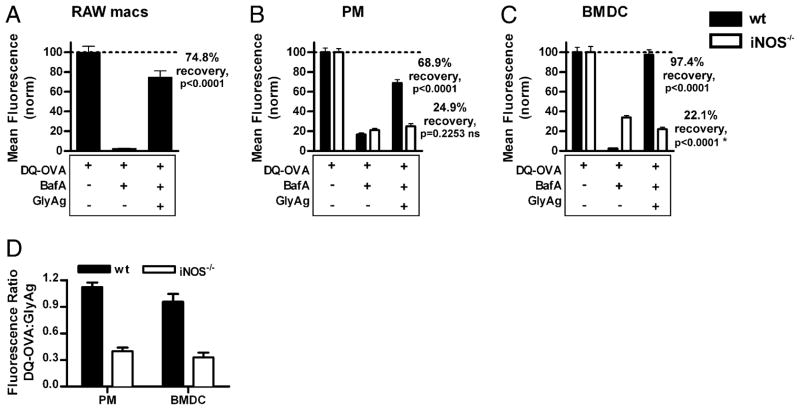
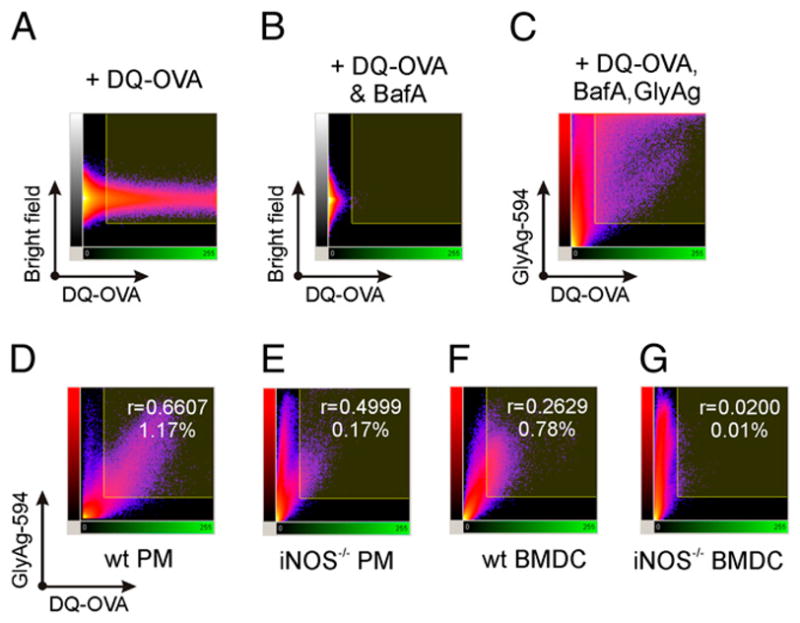
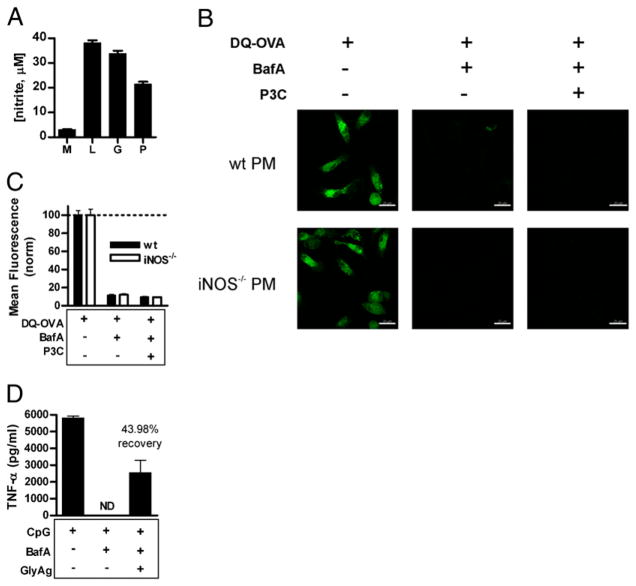
Phagocytes kill encapsulated microbes through oxidative cleavage of surface carbohydrates, releasing glycan fragments and microbial contents that serve as ligands for immune receptors, which tailor the immune response against the offending pathogen. The glycan fragments serve as MHC class II (MHC II) ligands and innate receptor agonists, whereas microbial proteins serve as substrates for proteolytic cleavage and MHC II presentation, and released nucleic acids activate innate pattern-recognition receptors (e.g., TLR9). In the current study, confocal microscopy of live macrophages and dendritic cells revealed that endocytosis of carbohydrates lead to vesicular acidification independent of proton pump activity. Acidification was dependent on NO-mediated oxidation in the presence of the ingested carbohydrate and was sufficient to negatively regulate T cell-dependent polysaccharide Ag cleavage, promote acid-dependent protein Ag processing, and facilitate CpG-mediated TLR9 signaling. Our findings lead to a model in which oxidation of carbohydrates from encapsulated microbes facilitates adaptive immune responses against microbial protein and carbohydrate Ags through promoting Ag processing for MHC II-mediated presentation as well as innate responses against released microbial DNA via TLR9 signaling.


Conflict of interest statement

Disclosures

The authors have no financial conflicts of interest.

Figures

FIGURE 1
FIGURE 1
NO is produced by macrophages and dendritic cells in response to GlyAg. Unless noted otherwise, NO production was detected using 10 μM DAF-FM. Cells were treated with DAF-FM, GlyAg in PBS at 100 μg/ml (1 μM) or as labeled, or PBS alone. Data represent the change in fluorescence over PBS control. All data (except flow cytometry) are n = 9, and error bars represent SEM. A, Significant NO was produced in human and murine cultured macrophage cell lines in response to GlyAg. B, Time course of NO production in murine RAW macrophages, revealed a t1/2 (time to reach half completion) of 24.6 ± 1.1 h, suggesting de novo synthesis of the iNOS enzyme was required. C, NO production in RAW macrophages showed that 0.74 ± 0.6 μM of GlyAg was required to reach a half-maximal response, illustrating the dose-dependence of the NO response. D, Significant NO was produced on a per cell basis in RAW macrophages over background (filled black histogram, unstained cells; blue, unstimulated but stained cells) as measured by flow cytometry 24 h after stimulation with GlyAg (red). The response was reduced by 100 mM L-NAME (iNOS inhibitor; green), confirming the specificity of NO detection. Inset bar graph shows the mean fluorescence intensity in match color scheme. E, Nitrite concentration in RAW macrophage spent media was measured in untreated (M) or stimulated cells (L, 100 ng/ml LPS; G, 100 μg/ml GlyAg) as determined by the Griess reagent at 48 h, confirming NO secretion. Inhibition of NO production was achieved using the iNOS-specific inhibitor 1400W at 0.1 mM (G + I) to verify the mechanism of NO synthesis. F, NO production was also readily detectable using DAF-FM in primary murine PMs and BMDCs from WT C57BL6 mice. The data presented in this figure show that GlyAgs stimulate significant NO synthesis in a variety of professional APCs known to process and present GlyAg to T cells.
FIGURE 2
FIGURE 2
BafA inhibits intracellular acidification. WT (A) or iNOS−/− (B) peritoneal macrophages were treated with (+) and without (−) 40 nM BafA overnight, then all were treated with 2 μM LysoSensor Green (Lyso) and fluorescence was measured by flow cytometry to evaluate vesicular pH. Additional cells were not treated with BafA or Lyso (unt). Cells not treated with BafA displayed high levels of Lyso fluorescence (i.e., vesicular acidification [gray bar and histogram]), and the addition of BafA (black bar and histogram) reduced the fluorescence by ~45% in both WT and iNOS−/−. Number above bars on the bar graph indicate corresponding mean fluorescence intensity.
FIGURE 3
FIGURE 3
GlyAg oxidation leads to intracellular acidification. All images taken with a 63× oil immersion lens. A, APCs were treated with 40 nM BafA to block normal acidification and 2 μM Lyso to detect vesicular pH and then incubated with 50 μg/ml AlexaFluor594-conjugated GlyAg (GlyAg-594) for 18 h. We found that RAW macrophages and WT primary cells showed intense green fluorescence, indicating acidic pH, and significant colocalization (yellow), indicating that the acidic environment occurred primarily in vesicles loaded with GlyAg. In contrast, iNOS−/− cells showed little colocalization, and the green signal remained unchanged (no increase in fluorescence over background levels), collectively suggesting that NO-mediated oxidation in the presence of GlyAg was required for acidification. Colocalization was determined using Imaris imaging software. Scale bar, 20 μm. B, Representative scatterplots of each fluorescent pixel from confocal images with LysoSensor Green fluorescent intensity along the x-axis and GlyAg fluorescent intensity along the y-axis. The shaded area in the upper right quadrant represents colocalized pixels (i.e., double-positive for red and green) above background with the associated Pearson correlation coefficient indicated for all colocalized pixels, as calculated using Imaris CoLoc software. NO-producing cells showed a direct correlation between GlyAg and acidification, which was lost in the absence of NO-mediated oxidation.
FIGURE 4
FIGURE 4
Vesicular acidification is GlyAg-concentration–dependent and overcomes BafA inhibition. Live APCs were treated with 40 nM BafA and 50 μg/ml AlexaFluor-conjugated GlyAg overnight, washed, and treated with 2 μM LysoSensor Green for 25 min, after which 10 confocal images in the z-axis were captured for each sample. The mean intensity of GlyAg and LysoSensor signals were quantified for 100 subcellular ROIs using the Leica Application Suite software and graphed in order of brightest to weakest GlyAg signal. WT PMs (A) and BMDCs (B) showed a positive correlation between GlyAg intensity (black bars) and Lyso intensity (gray bars), in that as GlyAg concentration increased, the degree of acidification followed in a colocalized manner. This correlation was significantly reduced in the iNOS−/− PMs (C) and BMDCs (D), demonstrating that acidification (increased Lyso intensity) was locally sensitive to GlyAg concentration and depended on NO-mediated oxidation. Furthermore, global fluorescence intensity values for each image were normalized to LysoSensor-only samples (100%) and BafA-treated cells (0%) of each respective cell type. The percent acidification recovery was then determined for GlyAg-treated WT and iNOS−/− cells. In cells capable of NO synthesis (EG, filled bars), GlyAg led to significant recovery of acidification. iNOS−/− PMs (F, open bars) showed a significant decrease in recovery compared with WT PMs, whereas the NO-deficient BMDCs were completely unable to recover (G, open bars). Statistical analysis was performed between Lyso-only samples and GlyAg-treated samples. In iNOS−/− PMs and BMDCs, there is a significant statistical difference indicating that the percent recovery failed to achieve BafA-negative levels, whereas the WT cells achieved BafA-negative levels. Data represent eight separate images for each treatment group, and cell type and error bars represent SEM. ND, none detected (i.e., no increased LysoSensor fluorescence over BafA treated samples).
FIGURE 5
FIGURE 5
NO oxidation of GlyAg leads to enhanced pH-dependent OVA processing. All images taken with a 63× oil immersion lens. Confocal images of untreated APCs (left column), APCs treated with 40 nM BafA to inhibit normal acidification (second column), and BafA-treated APCs incubated with 50 μg/ml AlexaFluor594-conjugated GlyAg (three right columns). All cells were incubated with 50 μg/ml DQ-OVA for 25 min before image capture. All cells readily processed DQ-OVA upon internalization (green), but cleavage was strongly inhibited by BafA (second column) as expected. Although all cells were equally able to endocytose GlyAg (red), only RAW macrophages and WT primary APCs were able to process OVA above the BafA background (middle column; green) when incubated with GlyAg. Colocalization images (blue; Imaris CoLoc software) show that essentially all green regions of the cells were also GlyAg positive (compare the green and blue images), suggesting that the pH effect was strictly localized. In contrast, both NO-deficient cells were unable to initiate acid-dependent processing of OVA, indicating that NO-mediated oxidation in the presence of GlyAg generated an acidic environment that promotes protein Ag processing. Scale bars, 20 μm.
FIGURE 6
FIGURE 6
NO-capable cells demonstrate GlyAg-induced recovery of inhibited protein processing. Confocal images for each cell type and treatment condition (DQ-OVA for 25 min in cells treated ± BafA ± GlyAg overnight as shown in Fig. 5) were collected and quantified using the mean ROI intensity (n ≥ 40 ROIs per sample) and then normalized to the respective untreated samples to determine the percent pH-dependent proteolysis recovery following BafA treatment. Error bars represent SEM. Cells capable of NO production (AC, filled bars) showed significant recovery of protein processing when BafA-treated cells were given GlyAg. This effect was lost in NO-deficient cells (B, C, open bars). Statistical analysis was performed between Lyso, BafA-treated samples, and GlyAg-treated samples. In both WT PMs and BMDCs, there is a statistically significant change in OVA cleavage induced by the addition of GlyAg to NO-capable cells, but this difference is not present in iNOS−/− cells. *There is a statistical difference between the mean fluorescence of iNOS−/− BMDCs when treated with BafA only or with BafA with GlyAg; however, the addition of GlyAg results in a lower mean fluorescence rather than recovery. D, We examined the strength of the relationship between NO- and GlyAg-induced acidification and protein processing by evaluating the mean ROI intensities (n ≥ 40 ROIs per sample) as fluorometric ratios of DQ-OVA fluorescence:GlyAg fluorescence, because DQ-OVA fluorescence is pH-sensitive whereas GlyAg fluorescence is pH-insensitive. Both WT PMs and BMDCs demonstrated a much higher fluorescence ratio than did their iNOS−/− counterparts. These data show that carbohydrate oxidation by NO generates an acidic environment conducive to protein Ag processing within endosomes.
FIGURE 7
FIGURE 7
GlyAg oxidation-mediated acidification is limited to GlyAg+ vesicles. Using three-dimensional reconstructions of the data sets (Figs. 5, 6), the individual pixel intensities were also mapped in scatterplots to quantify colocalization of OVA processing and GlyAg. Cells given DQ-OVA only (no GlyAg or BafA) displayed a large number of green pixels, which represent processed OVA (A), whereas BafA blocks proteolysis, as seen with a significantly reduced number of green pixels (B). When RAW macrophages were incubated with BafA and GlyAg (C), all bright green regions (i.e., processed OVA) were also positive for GlyAg (double positive, upper right quadrant). Many cell regions were positive for GlyAg only, but no regions were positive for OVA processing alone. The same pattern was observed in primary WT cells (D, F), in that green pixels were nearly always positive for red, but not vice versa. Conversely, NO-deficient cells show dramatically reduced numbers of green pixels and colocalization (E, G). These data confirm that carbohydrate oxidation by NO had a local pH effect within individual GlyAg+ endosomes. All values, including the Pearson correlation coefficients (r values) were determined by the Imaris CoLoc software.
FIGURE 8
FIGURE 8
P3C-mediated TLR2 signaling and NO production is inadequate to induce acidification, yet GlyAg oxidation promotes CpG-mediated TLR9 signaling (A). To verify P3C-induced NO production, RAW macrophages were stimulated with 15 nM P3C (P), 100 ng/ml LPS (L), 100 μg/ml GlyAg (G), or left untreated (M); spent media were analyzed for nitrite concentration at 48 h as determined by the Griess reagent (n = 3). All Ags stimulated significant NO production. B, PMs were treated with 40 nM BafA then 15 nM P3C overnight, washed, and incubated with 50 μg/ml DQ-OVA for 25 min. Multiple confocal images (63×) for both WT and iNOS−/− PMs and each treatment condition were taken, which showed little to no green signal and therefore no OVA processing in BafA-treated cells given P3C. Scale bar, 20 μm. C, Images were analyzed using the Leica Application Suite for ROI mean intensity values (n ≥ 40 ROIs per sample; error bars are SEM) and normalized to the respective DQ-OVA–only positive control samples. Despite P3C-mediated, TLR2-dependent synthesis of NO (not shown), P3C failed to induce acidification in PMs over the BafA-treatment, suggesting that both NO and NO oxidation of GlyAg were collectively necessary to achieve acidification. D, RAW macrophages were treated with 40 nM BafA overnight to inhibit TLR9 signaling and then stimulated with 1 μg/ml CpG with and without 50 μg/ml GlyAg. Supernatants were removed 24 h later, and the amount of TNFα produced was determined by ELISA. TNFα production was normalized to the control (CpG without BafA) and compared with the cells incubated with and without GlyAg and BafA. As expected, BafA eliminated TLR9 signaling, but GlyAg oxidation was able to restore 43.98% of the TNFα production induced by CpG and TLR9. Error bars represent SEM. ND, not detected.
FIGURE 9
FIGURE 9
GlyAg oxidation releases protons and self-limits subsequent cleavage. GlyAg was dissolved in diH2O or PBS at 1 mg/ml and treated with ozone gas for 0, 15, 30, 45, or 60 min to induce oxidative cleavage. Each time point aliquot was analyzed for molecular mass on a Superdex 75 size-exclusion column and pH. A, When carbohydrate was oxidized in a nonbuffered solution (diH2O), the pH dropped to <5.0 within the first several minutes (inset), and this correlated to only modest cleavage following the acidic pH change and maintenance of fragments broadly averaging 9 kDa. B, When carbohydrate was oxidized in a buffered system (PBS), the pH remained above 6.0 for most of the time course (inset), and this correlated to dramatically increased cleavage that resulted in large concentrations of single monosaccharide fragments (EV = ~22 ml), which have never been detected in APC vesicles and are incapable of MHC II binding and presentation. These data revealed that GlyAg oxidation resulted in the rapid release of protons from the GlyAg, which inhibited further cleavage in a classical product-inhibition feedback manner.

Similar articles

Cited by

References

    1. Cobb BA, Kasper DL. Zwitterionic capsular polysaccharides: the new MHC II-dependent antigens. Cell Microbiol. 2005;7:1398–1403. - PubMed
    1. Velez CD, Lewis CJ, Kasper DL, Cobb BA. Type I Streptococcus pneumoniae carbohydrate utilizes a nitric oxide and MHC II-dependent pathway for antigen presentation. Immunology. 2009;127:73–82. - PMC - PubMed
    1. Cobb BA, Wang Q, Tzianabos AO, Kasper DL. Polysaccharide processing and presentation by the MHC II pathway. Cell. 2004;117:677–687. - PMC - PubMed
    1. Wang Q, McLoughlin RM, Cobb BA, Charrel-Dennis M, Zaleski KJ, Golenbock D, Tzianabos AO, Kasper DL. A bacterial carbohydrate links innate and adaptive responses through Toll-like receptor 2. J Exp Med. 2006;203:2853–2863. - PMC - PubMed
    1. Brubaker JO, Li Q, Tzianabos AO, Kasper DL, Finberg RW. Mitogenic activity of purified capsular polysaccharide A from Bacteroides fragilis: differential stimulatory effect on mouse and rat lymphocytes in vitro. J Immunol. 1999;162:2235–2242. - PubMed

Publication types

MeSH terms