

Testosterone concentrations in diabetic and nondiabetic obese men
- PMID: 20200299
- PMCID: PMC2875421
- DOI: 10.2337/dc09-1649
Testosterone concentrations in diabetic and nondiabetic obese men
Erratum in
- Diabetes Care. 2010 Aug;33(8):1911
Abstract
Objective: To determine the prevalence of subnormal testosterone concentrations in patients with obesity and with type 2 diabetes in a primary care clinic population.
Research design and methods: Free testosterone concentrations of 1,849 men (1,451 nondiabetic and 398 diabetic) in the Hypogonadism In Males (HIM) study were analyzed. The HIM study was a U.S.-based cross-sectional study designed to define the prevalence of hypogonadism in men aged >45 years. Free testosterone was measured by equilibrium dialysis.
Results: The prevalence of subnormal free testosterone concentrations in lean, overweight, and obese nondiabetic men was 26% (n = 275), 29% (n = 687), and 40% (n = 489), respectively (P < 0.001 for trend), and 44% (n = 36), 44% (n = 135), and 50% (n = 227), respectively, in diabetic men (P = 0.46 for trend within group and P < 0.05 compared with nondiabetic men). The mean free testosterone concentration of diabetic men was significantly lower than that of nondiabetic men. Free testosterone concentrations were negatively and significantly (P < 0.001) related to age (r = -0.37), BMI (r = -0.18), and sex hormone-binding globulin (r = -0.11) in multiple regression analysis. The average decline of free testosterone concentrations was 7.8 pg/ml per decade in nondiabetic men and 8.4 pg/ml per decade in diabetic men.
Conclusions: Forty percent of obese nondiabetic men and 50% of obese diabetic men aged >or=45 years have subnormal free testosterone concentrations. In view of its high prevalence, obesity is probably the condition most frequently associated with subnormal free testosterone concentrations in males. The concomitant presence of diabetes is associated with an additional increase in the prevalence of subnormal free testosterone concentrations.
Figures
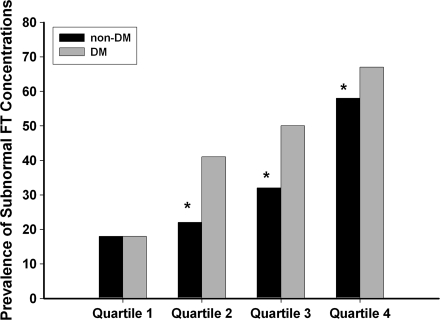
 ) and nondiabetic (non-DM, ■) men separated into quartiles of age. Quartile 1 (aged 45–52 years) had 408 nondiabetic and 55 diabetic men. Quartile 2 (aged 53–59 years) had 378 nondiabetic and 82 diabetic men. Quartile 3 (aged 60–68 years) had 326 nondiabetic and 136 diabetic men. Quartile 4 (aged 69–91 years) had 339 nondiabetic and 125 diabetic men. The prevalence of subnormal free testosterone concentrations was calculated in each quartile for nondiabetic and diabetic men. The prevalence was then adjusted to the mean BMI (29.7 kg/m2) of the whole study population. A χ2 test was used to compare the prevalence among groups. A similar percentage of nondiabetic and diabetic men in quartile 1 had subnormal free testosterone (18 vs. 18%, P = 0.97). Nondiabetic men had a lower prevalence of subnormal free testosterone than diabetic men in the other three quartiles (quartile 2, 22 vs. 41%, P < 0.01; quartile 3, 32 vs. 50%, P < 0.01; and quartile 4, 58 vs. 67%, P = 0.05).
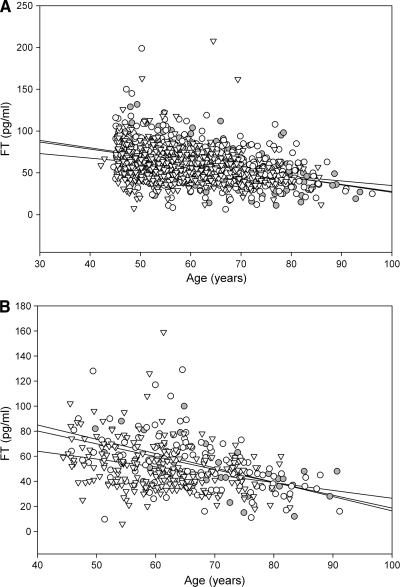 , diabetic men. B: Inverse relationship of age with free testosterone in lean (
 , r = −0.57, P < 0.001), overweight (○, r = −0.49, P < 0.001), and obese (▽, r = −0.30, P < 0.001) diabetic men. Thus, although age could explain 25–30% of variability (R2) in free testosterone concentrations in nonobese individuals, it accounted for a significantly lower variability (9%) in free testosterone in obese diabetic men (P = 0.05 compared with nonobese men). C: Relationship of free testosterone with BMI in lean (, r = 0.01, P = 0.9), overweight (○, r = −0.08, P = 0.04), and obese (▽, r = −0.10, P = 0.03) non-diabetic men. D: Relationship of free testosterone with BMI in lean (, r = 0.13, P = 0.5), overweight (○, r = 0.03, P = 0.8), and obese (▽, r = −0.17, P < 0.01) diabetic men.
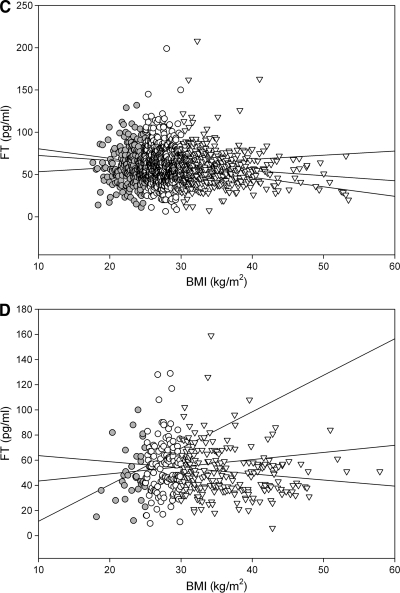 , diabetic men. B: Inverse relationship of age with free testosterone in lean (, r = −0.57, P < 0.001), overweight (○, r = −0.49, P < 0.001), and obese (▽, r = −0.30, P < 0.001) diabetic men. Thus, although age could explain 25–30% of variability (R2) in free testosterone concentrations in nonobese individuals, it accounted for a significantly lower variability (9%) in free testosterone in obese diabetic men (P = 0.05 compared with nonobese men). C: Relationship of free testosterone with BMI in lean (, r = 0.01, P = 0.9), overweight (○, r = −0.08, P = 0.04), and obese (▽, r = −0.10, P = 0.03) non-diabetic men. D: Relationship of free testosterone with BMI in lean (, r = 0.13, P = 0.5), overweight (○, r = 0.03, P = 0.8), and obese (▽, r = −0.17, P < 0.01) diabetic men.
References
-
- Dhindsa S, Prabhakar S, Sethi M, Bandyopadhyay A, Chaudhuri A, Dandona P: Frequent occurrence of hypogonadotropic hypogonadism in type 2 diabetes. J Clin Endocrinol Metab 2004;89:5462–5468 - PubMed
-
- Dhindsa S, Bhatia V, Dhindsa G, Chaudhuri A, Gollapudi GM, Dandona P: The effects of hypogonadism on body composition and bone mineral density in type 2 diabetic patients. Diabetes Care 2007;30:1860–1861 - PubMed
-
- Kapoor D, Aldred H, Clark S, Channer KS, Jones TH: Clinical and biochemical assessment of hypogonadism in men with type 2 diabetes: correlations with bioavailable testosterone and visceral adiposity. Diabetes Care 2007;30:911–917 - PubMed
-
- Grossmann M, Thomas MC, Panagiotopoulos S, Sharpe K, Macisaac RJ, Clarke S, Zajac JD, Jerums G: Low testosterone levels are common and associated with insulin resistance in men with diabetes. J Clin Endocrinol Metab 2008;93:1834–1840 - PubMed
-
- Tomar R, Dhindsa S, Chaudhuri A, Mohanty P, Garg R, Dandona P: Contrasting testosterone concentrations in type 1 and type 2 diabetes. Diabetes Care 2006;29:1120–1122 - PubMed
Publication types
MeSH terms
Substances
Grants and funding
LinkOut - more resources
Full Text Sources
Other Literature Sources
Medical
