

Glycated hemoglobin, diabetes, and cardiovascular risk in nondiabetic adults
- PMID: 20200384
- PMCID: PMC2872990
- DOI: 10.1056/NEJMoa0908359
Glycated hemoglobin, diabetes, and cardiovascular risk in nondiabetic adults
Abstract
Background: Fasting glucose is the standard measure used to diagnose diabetes in the United States. Recently, glycated hemoglobin was also recommended for this purpose.
Methods: We compared the prognostic value of glycated hemoglobin and fasting glucose for identifying adults at risk for diabetes or cardiovascular disease. We measured glycated hemoglobin in whole-blood samples from 11,092 black or white adults who did not have a history of diabetes or cardiovascular disease and who attended the second visit (occurring in the 1990-1992 period) of the Atherosclerosis Risk in Communities (ARIC) study.
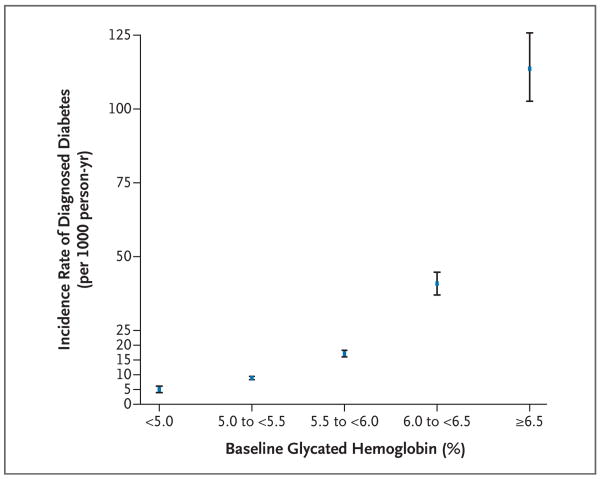
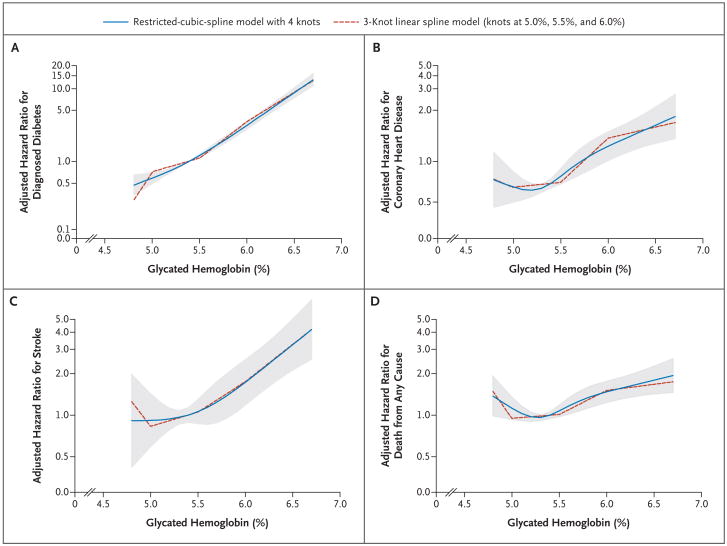
Results: The glycated hemoglobin value at baseline was associated with newly diagnosed diabetes and cardiovascular outcomes. For glycated hemoglobin values of less than 5.0%, 5.0 to less than 5.5%, 5.5 to less than 6.0%, 6.0 to less than 6.5%, and 6.5% or greater, the multivariable-adjusted hazard ratios (with 95% confidence intervals) for diagnosed diabetes were 0.52 (0.40 to 0.69), 1.00 (reference), 1.86 (1.67 to 2.08), 4.48 (3.92 to 5.13), and 16.47 (14.22 to 19.08), respectively. For coronary heart disease, the hazard ratios were 0.96 (0.74 to 1.24), 1.00 (reference), 1.23 (1.07 to 1.41), 1.78 (1.48 to 2.15), and 1.95 (1.53 to 2.48), respectively. The hazard ratios for stroke were similar. In contrast, glycated hemoglobin and death from any cause were found to have a J-shaped association curve. All these associations remained significant after adjustment for the baseline fasting glucose level. The association between the fasting glucose levels and the risk of cardiovascular disease or death from any cause was not significant in models with adjustment for all covariates as well as glycated hemoglobin. For coronary heart disease, measures of risk discrimination showed significant improvement when glycated hemoglobin was added to models including fasting glucose.
Conclusions: In this community-based population of nondiabetic adults, glycated hemoglobin was similarly associated with a risk of diabetes and more strongly associated with risks of cardiovascular disease and death from any cause as compared with fasting glucose. These data add to the evidence supporting the use of glycated hemoglobin as a diagnostic test for diabetes.
2010 Massachusetts Medical Society
Figures
Comment in
-
Glycated hemoglobin, diabetes, and cardiovascular risk in nondiabetic adults.N Engl J Med. 2010 May 27;362(21):2030; author reply 2031. doi: 10.1056/NEJMc1003829. N Engl J Med. 2010. PMID: 20505184 No abstract available.
-
Glycated hemoglobin, diabetes, and cardiovascular risk in nondiabetic adults.N Engl J Med. 2010 May 27;362(21):2030-1; author reply 2031. N Engl J Med. 2010. PMID: 20518103 No abstract available.
-
Diabetes: Prognostic validity of HbA1c levels in nondiabetic adults.Nat Rev Endocrinol. 2010 Jun;6(6):296. doi: 10.1038/nrendo.2010.53. Nat Rev Endocrinol. 2010. PMID: 20518124 No abstract available.
-
Etiology. Higher "normal" glycated hemoglobin levels were associated with increased risk for diabetes, CVD, stroke, and mortality in adults.Ann Intern Med. 2010 Jul 20;153(2):JC1-13. doi: 10.7326/0003-4819-153-2-201007200-02013. Ann Intern Med. 2010. PMID: 20643979 No abstract available.
-
La HbA1c, un marcador de diabetes, enfermedad cardiovascular y muerte en población adulta no diabética.Rev Clin Esp. 2011 Nov;211(10):533-4. doi: 10.1016/j.rce.2011.05.011. Rev Clin Esp. 2011. PMID: 22167845 Spanish. No abstract available.
References
-
- Selvin E, Crainiceanu CM, Brancati FL, Coresh J. Short-term variability in measures of glycemia and implications for the classification of diabetes. Arch Intern Med. 2007;167:1545–51. - PubMed
-
- Phillipou G, Phillips PJ. Intraindividual variation of glycohemoglobin: implications for interpretation and analytical goals. Clin Chem. 1993;39:2305–8. - PubMed
Publication types
MeSH terms
Substances
Grants and funding
- N01 HC055022/HC/NHLBI NIH HHS/United States
- N01 HC055016/HL/NHLBI NIH HHS/United States
- N01 HC055019/HL/NHLBI NIH HHS/United States
- N01-HC-55016/HC/NHLBI NIH HHS/United States
- N01 HC055018/HC/NHLBI NIH HHS/United States
- P30 DK079637/DK/NIDDK NIH HHS/United States
- N01 HC055015/HL/NHLBI NIH HHS/United States
- N01-HC-55021/HC/NHLBI NIH HHS/United States
- N01-HC-55019/HC/NHLBI NIH HHS/United States
- N01-HC-55015/HC/NHLBI NIH HHS/United States
- P60 DK079637/DK/NIDDK NIH HHS/United States
- N01-HC-55020/HC/NHLBI NIH HHS/United States
- N01 HC055015/HC/NHLBI NIH HHS/United States
- K24 DK62222/DK/NIDDK NIH HHS/United States
- R21 DK080294/DK/NIDDK NIH HHS/United States
- N01-HC-55018/HC/NHLBI NIH HHS/United States
- K24 DK062222/DK/NIDDK NIH HHS/United States
- N01 HC055016/HC/NHLBI NIH HHS/United States
- N01-HC-55022/HC/NHLBI NIH HHS/United States
- N01 HC055021/HL/NHLBI NIH HHS/United States
- N01 HC055020/HL/NHLBI NIH HHS/United States
- K01 DK076595/DK/NIDDK NIH HHS/United States
- N01 HC055019/HC/NHLBI NIH HHS/United States
- N01 HC055021/HC/NHLBI NIH HHS/United States
- N01 HC055018/HL/NHLBI NIH HHS/United States
- N01 HC055022/HL/NHLBI NIH HHS/United States
- N01 HC055020/HC/NHLBI NIH HHS/United States
LinkOut - more resources
Full Text Sources
Other Literature Sources
Medical