

Distinct gene signature revealed in white blood cells, CD4(+) and CD8(+) T cells in (NZBx NZW) F1 lupus mice after tolerization with anti-DNA Ig peptide
- PMID: 20200542
- PMCID: PMC10725082
- DOI: 10.1038/gene.2010.6
Distinct gene signature revealed in white blood cells, CD4(+) and CD8(+) T cells in (NZBx NZW) F1 lupus mice after tolerization with anti-DNA Ig peptide
Abstract
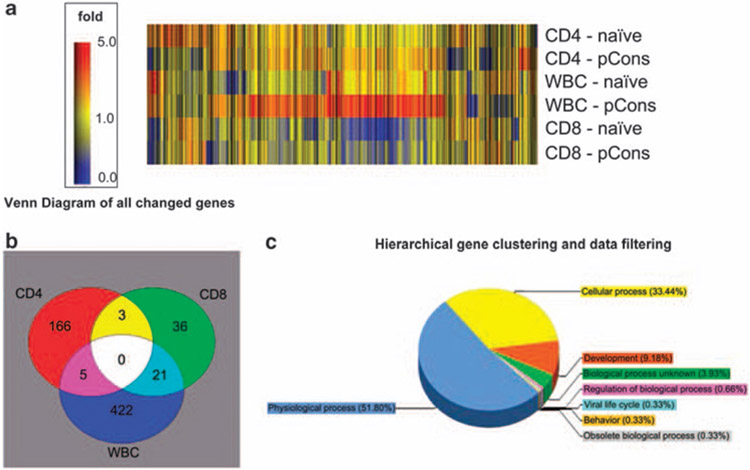
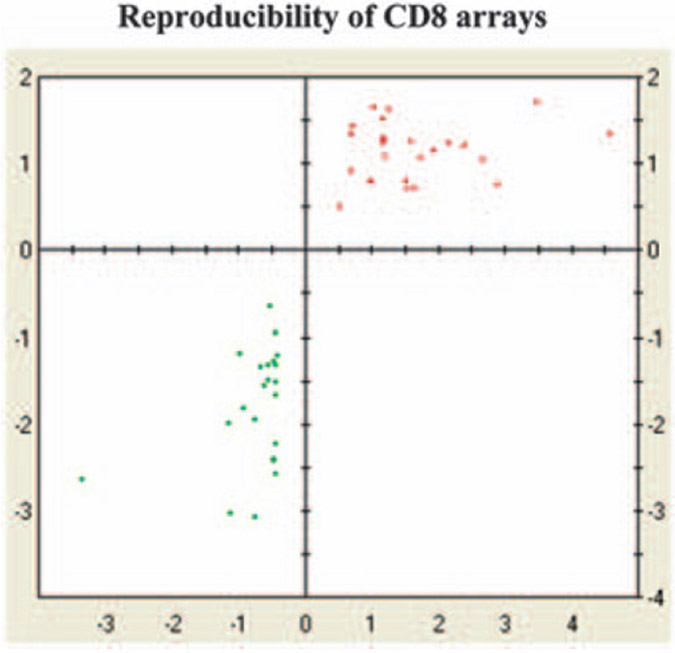
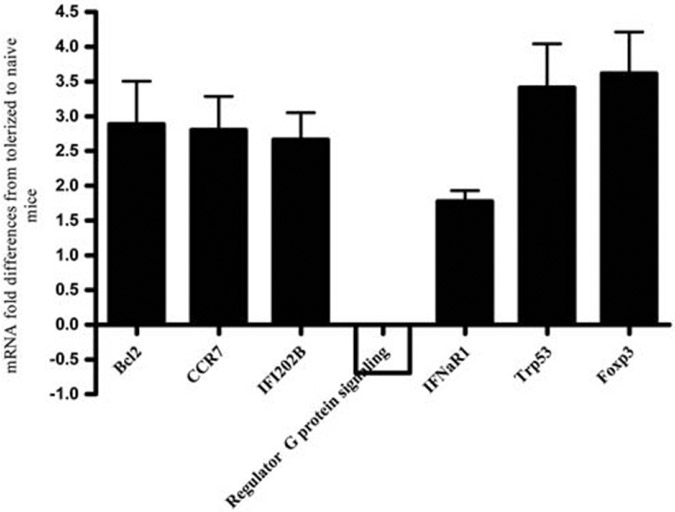
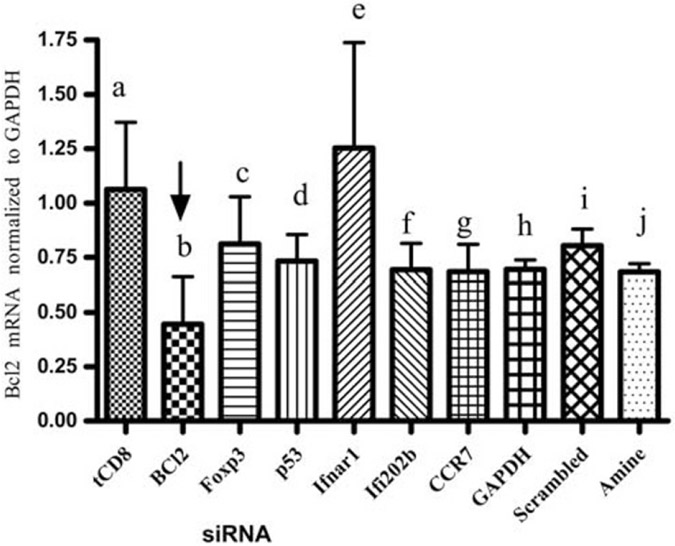
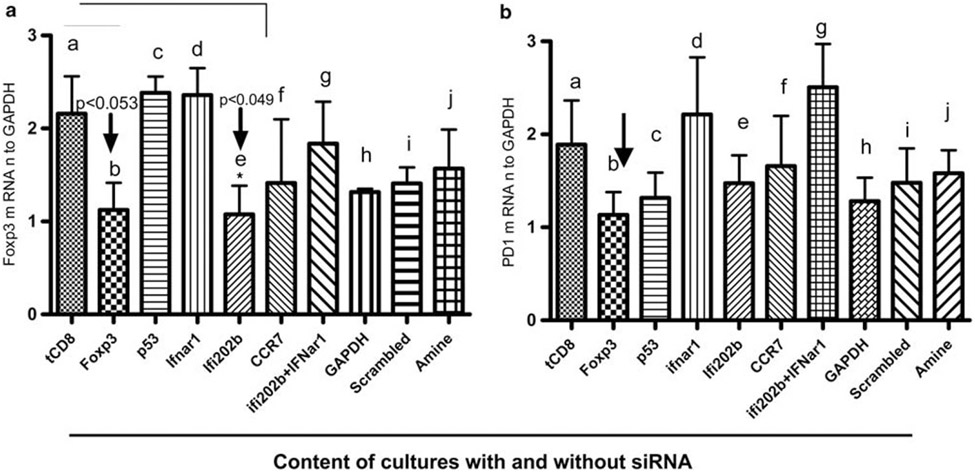
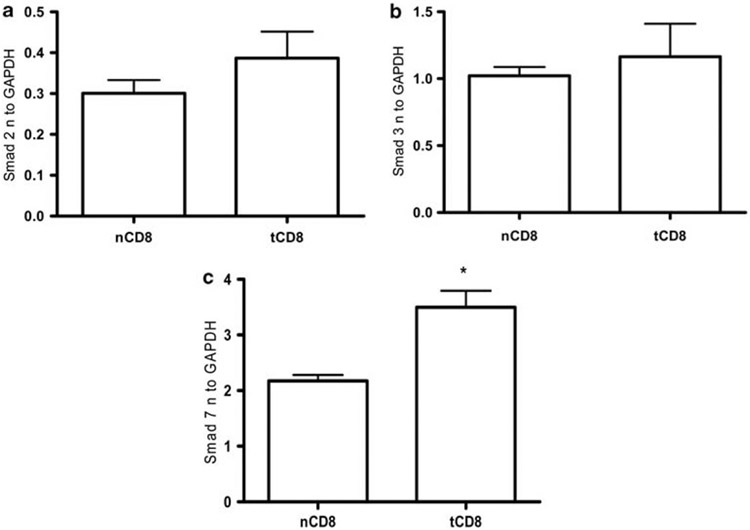
Tolerizing mice polygenically predisposed to lupus-like disease (NZB/NZW F1 females) with a peptide mimicking anti-DNA IgG sequences containing MHC class I and class II T cell determinants (pConsensus, pCons) results in protection from full-blown disease attributable in part to the induction of CD4(+)CD25(+)Foxp3+ and CD8(+)Foxp3+ regulatory T cells. We compared 45 000 murine genes in total white blood cells (WBC), CD4(+) T cells, and CD8(+) T cells from splenocytes of (NZBxNZW) F1 lupus-prone mice tolerized with pCons vs untreated naïve mice and found two-fold or greater differential expression for 448 WBC, 174 CD4, and 60 CD8 genes. We identified differentially expressed genes that played roles in the immune response and apoptosis. Using real-time PCR, we validated differential expression of selected genes (IFI202B, Bcl2, Foxp3, Trp-53, CCR7 and IFNar1) in the CD8(+)T cell microarray and determined expression of selected highly upregulated genes in different immune cell subsets. We also determined Smads expression in different immune cell subsets, including CD4(+) T cells and CD8(+) T cells, to detect the effects of TGF-beta, known to be the major cytokine that accounts for the suppressive capacity of CD8(+) Treg in this system. Silencing of anti-apoptotic gene Bcl2 or interferon genes (IFI202b and IFNar1 in combination) in CD8(+) T cells from tolerized mice did not affect the expression of the other selected genes. However, silencing of Foxp3 reduced expression of Foxp3, Ifi202b and PD1-all of which are involved in the suppressive capacity of CD8(+) Treg in this model.
Conflict of interest statement
Conflict of interest
Dr Divyen Patel, PhD and Dr Robert J Rooney, PhD, are employed at Genome Explorations Inc., Memphis, TN, USA. All other authors are employed at UCLA, Los Angeles, CA, USA and have no conflict of interest. Drs. Hahn, La Cava and Singh have a patent through the University of California, Los Angeles for the use of pCons as an immune modulator in systemic lupus erythematosus.
Figures

Similar articles
-
Interferon-inducible gene 202b controls CD8(+) T cell-mediated suppression in anti-DNA Ig peptide-treated (NZB × NZW) F1 lupus mice.Genes Immun. 2011 Jul;12(5):360-9. doi: 10.1038/gene.2011.4. Epub 2011 Feb 17. Genes Immun. 2011. PMID: 21326316 Free PMC article.
-
Cellular and Molecular Phenotypes of pConsensus Peptide (pCons) Induced CD8+ and CD4+ Regulatory T Cells in Lupus.Front Immunol. 2021 Nov 19;12:718359. doi: 10.3389/fimmu.2021.718359. eCollection 2021. Front Immunol. 2021. PMID: 34867947 Free PMC article.
-
pConsensus peptide induces tolerogenic CD8+ T cells in lupus-prone (NZB x NZW)F1 mice by differentially regulating Foxp3 and PD1 molecules.J Immunol. 2008 Feb 15;180(4):2069-80. doi: 10.4049/jimmunol.180.4.2069. J Immunol. 2008. PMID: 18250412
-
Cellular and molecular mechanisms of regulation of autoantibody production in lupus.Ann N Y Acad Sci. 2005 Jun;1051:433-41. doi: 10.1196/annals.1361.085. Ann N Y Acad Sci. 2005. PMID: 16126985 Free PMC article. Review.
-
Harnessing Tolerogenic Histone Peptide Epitopes From Nucleosomes for Selective Down-Regulation of Pathogenic Autoimmune Response in Lupus (Past, Present, and Future).Front Immunol. 2021 Apr 14;12:629807. doi: 10.3389/fimmu.2021.629807. eCollection 2021. Front Immunol. 2021. PMID: 33936042 Free PMC article. Review.
Cited by
-
Genes, tolerance and systemic autoimmunity.Autoimmun Rev. 2012 Jul;11(9):664-9. doi: 10.1016/j.autrev.2011.11.017. Epub 2011 Nov 30. Autoimmun Rev. 2012. PMID: 22155015 Free PMC article. Review.
-
Derangement of cell cycle markers in peripheral blood mononuclear cells of asthmatic patients as a reliable biomarker for asthma control.Sci Rep. 2021 Jun 4;11(1):11873. doi: 10.1038/s41598-021-91087-5. Sci Rep. 2021. PMID: 34088958 Free PMC article.
-
Effects of Peptide-Induced Immune Tolerance on Murine Lupus.Front Immunol. 2021 May 19;12:662901. doi: 10.3389/fimmu.2021.662901. eCollection 2021. Front Immunol. 2021. PMID: 34093553 Free PMC article.
-
Interferon-inducible gene 202b controls CD8(+) T cell-mediated suppression in anti-DNA Ig peptide-treated (NZB × NZW) F1 lupus mice.Genes Immun. 2011 Jul;12(5):360-9. doi: 10.1038/gene.2011.4. Epub 2011 Feb 17. Genes Immun. 2011. PMID: 21326316 Free PMC article.
-
Cellular and Molecular Phenotypes of pConsensus Peptide (pCons) Induced CD8+ and CD4+ Regulatory T Cells in Lupus.Front Immunol. 2021 Nov 19;12:718359. doi: 10.3389/fimmu.2021.718359. eCollection 2021. Front Immunol. 2021. PMID: 34867947 Free PMC article.
References
-
- Linker-Israeli M, Quismorio FP Jr, Horwitz DA. CD 8 lymphocytes from patients with systemic lupus erythematosus sustain, rather than suppress, spontaneous polyclonal IgG production and synergize with CD4+ cells to support autoantibody synthesis. Arthritis Rheum 1990; 33: 1216–1225. - PubMed
-
- Kotzin BL. Systemic lupus erythematosus. Cell 1996; 85: 303–306. - PubMed
-
- Hahn BH. Lessons in lupus: the mighty mouse. Lupus 2001; 10: 589–593. - PubMed
-
- Filaci G, Bacilieri S, Fravega M, Monetti M, Contini P, Ghio M et al. Impairment of CD8+ T suppressor cell function in patients with active systemic lupus erythematosus. J Immunol 2001; 166: 6452–6457. - PubMed
Publication types
MeSH terms
Substances
Grants and funding
LinkOut - more resources
Full Text Sources
Medical
Molecular Biology Databases
Research Materials
