. 2006 Feb 15;195(13-16):1722-1749.
doi: 10.1016/j.cma.2005.05.049.

Immersed finite element method and its applications to biological systems

Affiliations

Immersed finite element method and its applications to biological systems

Wing Kam Liu et al. Comput Methods Appl Mech Eng. .

Abstract

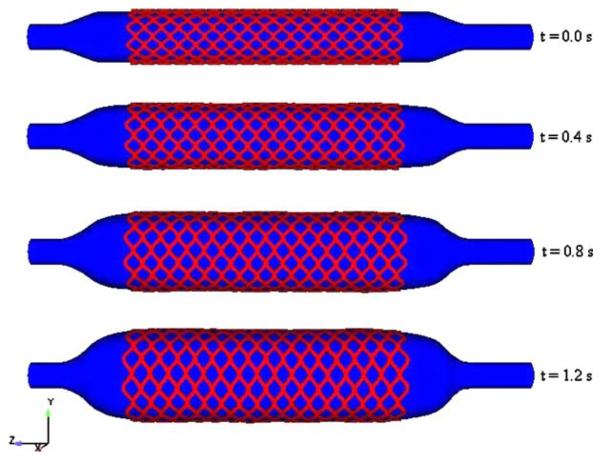
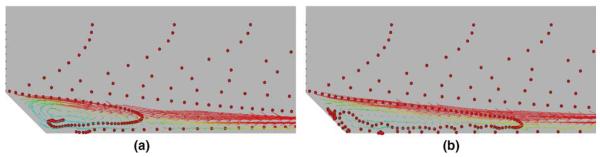
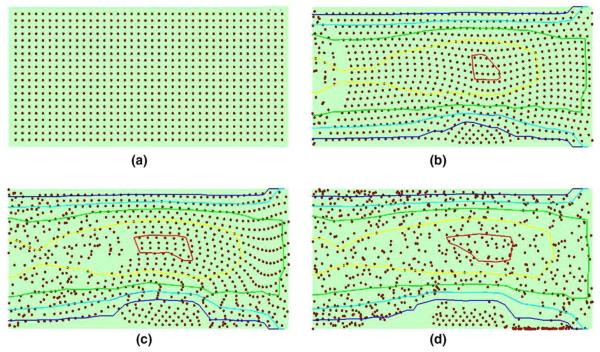
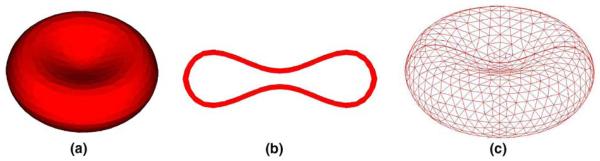
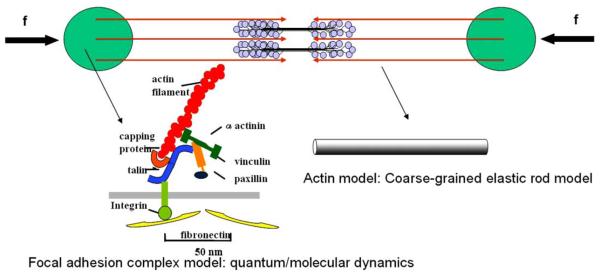
This paper summarizes the newly developed immersed finite element method (IFEM) and its applications to the modeling of biological systems. This work was inspired by the pioneering work of Professor T.J.R. Hughes in solving fluid-structure interaction problems. In IFEM, a Lagrangian solid mesh moves on top of a background Eulerian fluid mesh which spans the entire computational domain. Hence, mesh generation is greatly simplified. Moreover, both fluid and solid domains are modeled with the finite element method and the continuity between the fluid and solid subdomains is enforced via the interpolation of the velocities and the distribution of the forces with the reproducing Kernel particle method (RKPM) delta function. The proposed method is used to study the fluid-structure interaction problems encountered in human cardiovascular systems. Currently, the heart modeling is being constructed and the deployment process of an angioplasty stent has been simulated. Some preliminary results on monocyte and platelet deposition are presented. Blood rheology, in particular, the shear-rate dependent de-aggregation of red blood cell (RBC) clusters and the transport of deformable cells, are modeled. Furthermore, IFEM is combined with electrokinetics to study the mechanisms of nano/bio filament assembly for the understanding of cell motility.


Figures

Fig. 1
Fig. 1
Modeling of biological processes using a 3D multiscale technique.
Fig. 2
Fig. 2
The heart model [31]: (a) heart model immersed in the fluid mesh, (b) aortic valve.
Fig. 3
Fig. 3
Comparison of experimental observation and simulation result of a rubber sheet deflecting in a column of water. Pulsatile flow through the column (square cross-section) is from left to right at a frequency of 1 Hz. Velocity vectors and beam stress concentration can be seen in the simulation: (a) experiment, (b) simulation.
Fig. 4
Fig. 4
Design of the catheter, balloon and stent before inflation.
Fig. 5
Fig. 5
Deployment of the stent through the inflation of the balloon at different time steps.
Fig. 6
Fig. 6
Preliminary result of monocyte deposition in idealized blood vessel: (a) before sticking, (b) sticking.
Fig. 7
Fig. 7
Preliminary result of platelets adhesion and aggregation simulation. The streamline of the flow is plotted: (a) t = 0.0, (b) t = 0.33, (c) t = 0.66, (d) t = 1.0.
Fig. 8
Fig. 8
Preliminary result of platelets adhesion in blood flow: (a) t = 0, (b) t = 0.33, (c) t = 0.66, (d) t = 1.0.
Fig. 9
Fig. 9
A three-dimensional finite element mesh of a single RBC model: (a) 3D RBC model, (b) RBC cross-section, (c) RBC mesh.
Fig. 10
Fig. 10
Non-dimensionalized Morse potential and force.
Fig. 11
Fig. 11
Blood microscopic changes under different shear rates: (a) low shear region, (b) mid shear region, (c) high shear region.
Fig. 12
Fig. 12
The shear of a four-RBC cluster at the shear rate of 0.25, 0.5, and 3.0 s−1, respectively. The vectors represent the fluid velocity field.
Fig. 13
Fig. 13
The calculated effective viscosities of the blood at different shear rate.
Fig. 14
Fig. 14
Normal red blood cell flow with inlet velocity of 10 μm/s at different time steps: (a) t = 0, (b) t = 2.3, (c) t = 4.6, (d) t = 6.9.
Fig. 15
Fig. 15
The sickle cell flow with the inlet velocity of 10 μm/s at different time steps: (a) t = 0, (b) t = 2.3, (c) t = 4.6, (d) t = 6.9.
Fig. 16
Fig. 16
Three-dimensional simulation of a single red blood cell (essentially a hollow sphere for simplicity) squeezing through a capillary vessel: (a) t = 0.01, (b) t = 0.49, (c) t = 0.97, (d) t = 1.45.
Fig. 17
Fig. 17
The history of the driven pressure during the squeezing process.
Fig. 18
Fig. 18
Dynamic assembly/disassembly of actin during movement of Dictyostelium amoeba, a representative amoeboid cell. Rhodamine-actin was micro-injected with a volume marker fluorescein-BSA and the signal was rationed such that the intensity represents relative concentration of actin. The panel shows the dynamic change of actin assembly every 30 s. Pixel intensity was converted into color using an algorithm as shown by the color bar [39].
Fig. 19
Fig. 19
F-actin accumulation into cell–substrate anchoring structure. F-actin was visualized by expressing GFP-coronin, an actin-binding protein and imaged by spinning-disk laser confocal microscope at video rate. Pixel intensity was exhibited on the z-axis and then converted into color using an algorithm as shown by the color bar. The image sequence represents the F-actin dynamic every 30 s [40].
Fig. 20
Fig. 20
Continuum scale 3D simulation of cell migration. Stages of cell migration—protrusion, contraction, translocation—are shown. Colors indicate the stress inside the cell; the velocity vectors in the surrounding gel are also shown. The traction force vectors on the bottom of the cell are shown on the right. This force field can be measured by some novel nano-electro-mechanical-system (NEMS) devices [41].
Fig. 21
Fig. 21
A schematic figure of the ligand–receptor binding model for cell–substrate interaction. The bonds are modeled as springs. Reproduced from [48].
Fig. 22
Fig. 22
A schematic figure of the actomyosin contraction model. Each actin filament is illustrated as an arrow and its polarity is indicated. The double headed myosin-II motors are assumed to be distributed randomly inside the domain.
Fig. 23
Fig. 23
A schematic figure of the actomyosin-focal adhesion model. Each actin filament is illustrated as an arrow and its polarity is indicated. The two circular areas represent the focal adhesion sites. The double headed myosin-II motors are assembled into bipolar ‘mini-filaments’ that connect actin-filaments of opposite polarities. The focal adhesion complex will be modeled by quantum or molecular dynamic simulations. The actin filaments will be modeled as coarse-grained elastic rods. The contractile force will be applied onto the focal adhesion complex via atomistic–continuum coupling methods.
Fig. 24
Fig. 24
An elastic silicone membrane supported by a bed of silicone micro-needles: (a) bed of micro-needles, (b) the membrane supported by the micro-needle bed. The membrane will be coated with ECM ligands such that cells are attached and migrate in a similar manner as they do in vivo. The cellular traction forces posed on every FA will be quantitated by defining the topographic map of the membrane. Image: Courtesy of Juhee Hong, Junghoon Lee, School of Mechanical and Aerospace Engineering, Seoul National University.
Fig. 25
Fig. 25
A schematic drawing of proposed NEMS device to be used to measure the cellular traction forces. The device will be fabricated using nano-wires: (a) side view, (b) top view.
Fig. 26
Fig. 26
Simulation of the assembly of CNTs by the application of AC and DC fields. The first two sets of figures correspond to short CNTs assembling in AC field between semi-circular and parallel electrodes, respectively. The third set of figures is long CNTs alignment in DC field between semi-circular electrodes. All simulations are in 3D: (a) t = 0, (b) t = 0.5, (c) t = 1.0, (d) t = 0,(e) t = 0.5, (f) t = 1.0, (g) t = 0, (h) t = 0.5, (i) t = 1.0.

Similar articles

Cited by

References

    1. Tezduyar TE. Stabilized finite element formulations for incompressible-flow computations. Adv. Appl. Mech. 1992;28:1–44.
    1. Tezduyar TE. Finite element methods for flow problems with moving boundaries and interfaces. Arch. Comput. Methods Engrg. 2001;8(2):83–130.
    1. Huerta A, Liu WK. Viscous flow with large free surface motion. Comput. Methods Appl. Mech. Engrg. 1988;69:277–324.
    1. Hughes TJR, Liu WK, Zimmerman TK. Lagrangian–Eulerian finite element formulations for incompressible viscous flows. Comput. Methods Appl. Mech. Engrg. 1981;29:329–349.
    1. Liu WK. Finite element procedures for fluid–structure interactions and application to liquid storage tanks. Nucl. Engrg. Des. 1981;65:221–238.

LinkOut - more resources