. 2010 Mar;25(3):584-93.
doi: 10.1002/jbmr.3.

Gs G protein-coupled receptor signaling in osteoblasts elicits age-dependent effects on bone formation

Affiliations

Gs G protein-coupled receptor signaling in osteoblasts elicits age-dependent effects on bone formation

Edward C Hsiao et al. J Bone Miner Res. 2010 Mar.

Abstract

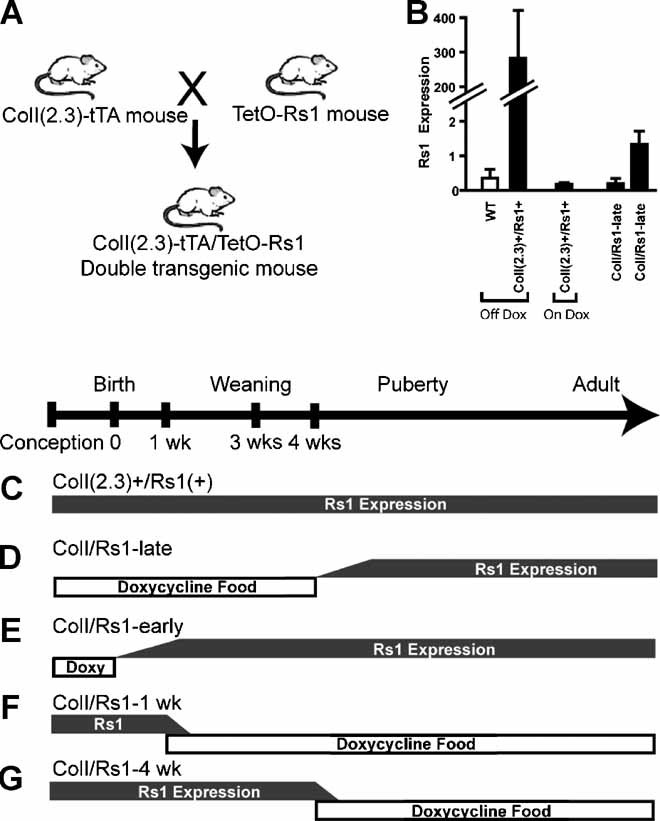
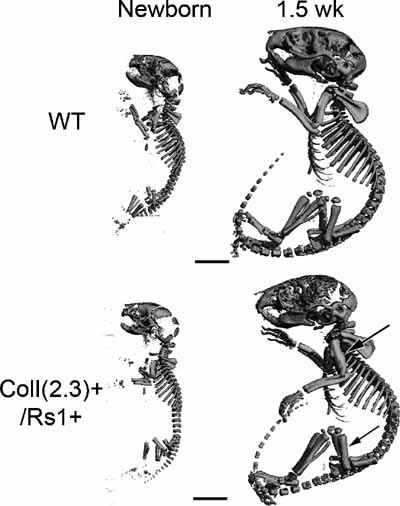
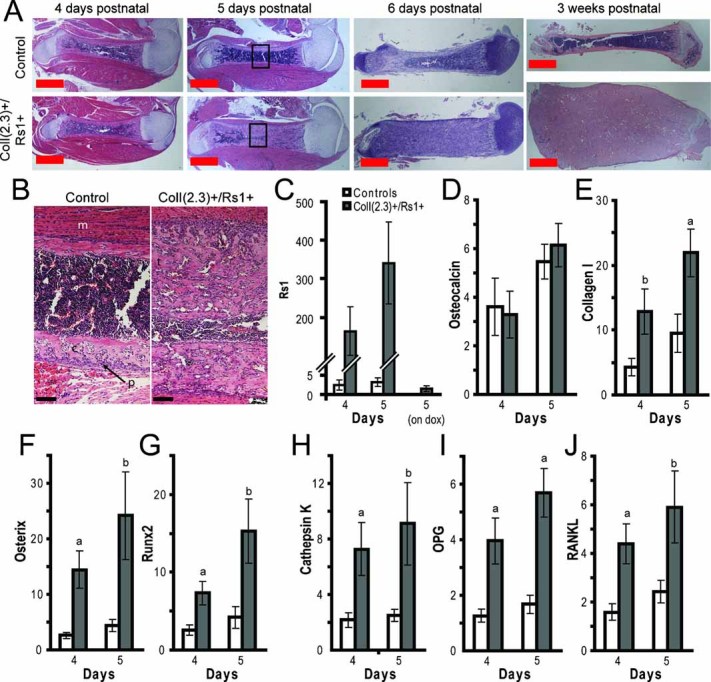
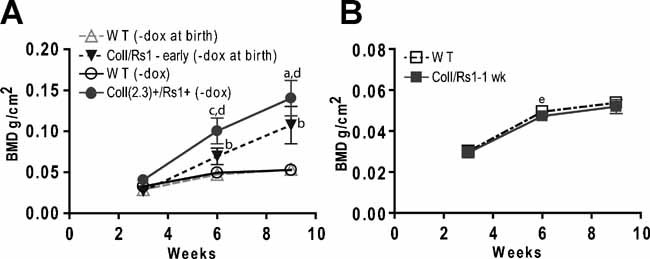
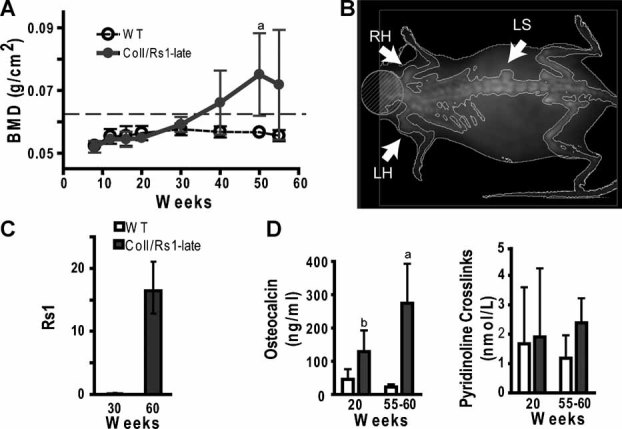
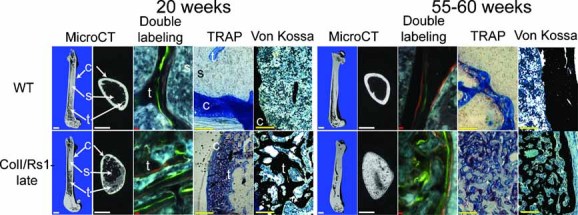
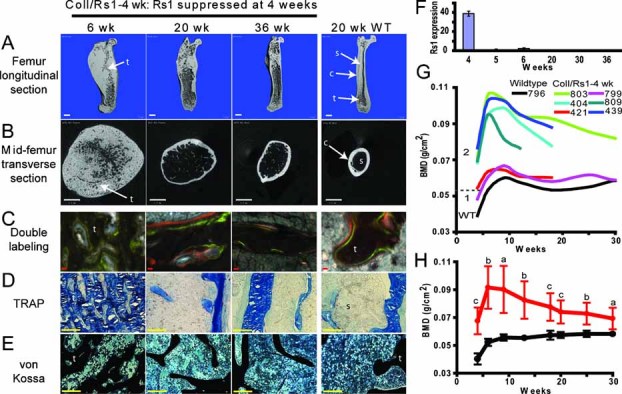
Age-dependent changes in skeletal growth are important for regulating skeletal expansion and determining peak bone mass. However, how G protein-coupled receptors (GPCRs) regulate these changes is poorly understood. Previously, we described a mouse model expressing Rs1, an engineered receptor with high basal G(s) activity. Rs1 expression in osteoblasts induced a dramatic age-dependent increase in trabecular bone with features resembling fibrous dysplasia. To further investigate how activation of the G(s)-GPCR pathway affects bone formation at different ages, we used the tetracycline-inducible system in the ColI(2.3)(+)/Rs1(+) mouse model to control the timing of Rs1 expression. We found that the Rs1 phenotype developed rapidly between postnatal days 4 and 6, that delayed Rs1 expression resulted in attenuation of the Rs1 phenotype, and that the Rs1-induced bone growth and deformities were markedly reversed when Rs1 expression was suppressed in adult mice. These findings suggest a distinct window of increased osteoblast responsiveness to G(s) signaling during the early postnatal period. In addition, adult bones encode information about their normal shape and structure independently from mechanisms regulating bone expansion. Finally, our model provides a powerful tool for investigating the effects of continuous G(s)-GPCR signaling on dynamic bone growth and remodeling.


Figures

Fig. 1
Fig. 1
Timing of Rs1 expression in the ColI(2.3)-tTA/TetO-Rs1 mice. (A) We used a doxycycline-regulated expression system to focus on the effects of basal Gs signaling induced by Rs1 expression without ligand activation. (B) Rs1 expression was allowed by feeding the mice regular doxycycline-free food. Six-week-old ColI(2.3)+/Rs1+ mice raised on regular food (Off Dox) had high levels of Rs1 expression. We suppressed Rs1 expression by giving doxycycline in the mouse chow (On Dox). Mice born and raised on doxycycline-containing food and subsequently switched to doxycycline-free food at 4 weeks of age show low but variable levels of Rs1 expression at 6 weeks of age (ColI/Rs1-late). Expression levels from femora of representative mice are shown. Portions of this figure use RNA samples from mice used in Fig. S5 as published.(11) Values are mean ± 1 SD of technical triplicates. (C–G) The pattern of doxycycline food administration and Rs1 expression for each experimental manipulation is indicated in gray. (C) ColI(2.3)+/Rs1+ mice: Rs1 expression was allowed from gestation through adulthood by feeding the pregnant mothers and their pups regular chow. (D) ColI/Rs1-late mice: Rs1 expression was suppressed through the first 4 weeks of development by feeding doxycycline chow to mothers during mating and to their pups after weaning. We switched the mice to regular chow at 4 weeks of age. (E) ColI/Rs1-early mice: Rs1 expression was allowed after birth by feeding the mother doxycycline chow from mating until delivery. The nursing mothers were switched to regular chow at delivery. (F) ColI/Rs1–1 week mice: Rs1 expression was allowed until 1 week of age by feeding the mothers regular chow from mating until 1 week after birth. The nursing mothers were switched to doxycycline chow to suppress Rs1 expression in the nursing pups. Weaned animals were maintained on doxycycline chow. (G) ColI/Rs1–4 week mice: Rs1 expression was allowed from gestation through 4 weeks of age by feeding mothers regular chow from mating through weaning. The pups were given regular chow until 4 weeks of age. Rs1 expression then was suppressed by switching the pups to doxycycline chow.
Fig. 2
Fig. 2
Mice expressing Rs1 from gestation showed no gross skeletal patterning defect. Note the subtle changes in bone size in the 1.5-week-old ColI(2.3)+/Rs1+ mice with mild thickening in the diaphyses of the femora and humeri (arrows). Scale bar = 5 mm.
Fig. 3
Fig. 3
Rs1-induced bone formation occurs between days 4 to 6 in postnatal skeletal growth. (A) Representative hematoxylin and eosin histology of paraffin-embedded decalcified femur sections of 4-, 5-, and 6-day-old and 3-week-old ColI(2.3)+/Rs1+ or control (wild-type or single-transgenic) mice. Note the increased trabecular bone, decreased cortical bone, and narrowed bone marrow space in the day 5 and 6 femora reminiscent of the changes seen in the 3-week-old mice. Skeletal muscle was left in place for 4- and 5-day-old samples to preserve adjacent bone morphology during processing. p = periosteum; s = bone marrow space; c = cortical bone; t = trabecular bone; m = skeletal muscle. Scale bar = 1 mm. (B) High-magnification images of day 5 control and ColI(2.3)+/Rs1+ femora (boxed regions in panel A) showing the increased trabecular bone resulting from Rs1 expression. (C–J) Relative expression levels by quantitative PCR of whole humeri from ColI(2.3)+/Rs1+ (filled bars) and control littermates (open bars). For the quantitative PCR, n = 6 control and 6 mutant 4-day-old mice; n = 6 control and 5 mutant 5-day-old mice. Expression levels were determined in technical triplicates for each mouse and normalized to GAPDH. Values are mean ± 1 SEM. a: p < .05 versus controls; b: p < .1 versus controls. (C) Rs1 expression in 4- and 5-day-old ColI(2.3)+/Rs1+ pups and littermate controls. Five-day-old ColI(2.3)+/Rs1+ pups from mothers fed doxycycline-containing food (day 5, on dox) demonstrate suppression of Rs1 expression, indicating that doxycycline fed to nursing mothers crossed adequately into breast milk. n = 4 ColI(2.3)+/Rs1+ pups maintained on doxycycline. (D, E) Osteocalcin and collagen I expression, markers of mature osteoblasts. (F, G) Osterix and runx2 expression, markers of immature osteoblasts. (H–J) Cathepsin K, OPG, and RANKL expression, markers of osteoclastogenesis.
Fig. 4
Fig. 4
Delayed Rs1 expression leads to a milder bone overgrowth phenotype. (A) ColI/Rs1-early mice in which Rs1 expression began after birth have intermediate whole-body BMD as compared to ColI(2.3)+/Rs1+ mice expressing Rs1 from gestation and similarly treated wild-type littermates. n = 4 WT (–dox at birth), 10 WT (–dox), 10 ColI(2.3)+/Rs1+ (–dox), and 6 ColI/Rs1-early (–dox at birth) at each time point. Values are mean ± 1 SD. a: p < .05 versus ColI/Rs1-early; b: p < .01 versus WT; c: p < .001 versus ColI/Rs1-early; d: p < .001 versus WT. (B) BMD in ColI/Rs1–1 week mice and wild-type littermates indicate that the abnormal bone phenotype is not maintained once Rs1 expression is discontinued. n = 9 WT and 5 mutant mice per time point. Values are mean ± 1 SD. e: p < .05 versus WT.
Fig. 5
Fig. 5
Expression of Rs1 after 4 weeks of age leads to long-term attenuation of the Rs1 phenotype. (A) Longitudinal whole-body aBMD showed a significant increase in average BMD as the ColI/Rs1-late mice aged. The dotted line indicates 2 SD above the WT BMD at 30 weeks (0.0613 g/cm2). n ≥ 4 mice for each time point. Values are mean ± 1 SD. a: p < .05 versus WT. (B) DXA image of a representative 60-week-old ColI/Rs1-late mouse showing isolated regions of subtle increased bone formation. RH = right humerus; LH = left humerus; LS = lumbar spine. (C) Rs1 expression in RNA isolated from whole humeri from representative ColI/Rs1-late mice showing low expression at 30 weeks (before the phenotype is evident) and higher expression at 60 weeks (when bone overgrowth is evident). Values represent mean ± 1 SD of technical triplicates. (D) Serum analysis of osteocalcin (a marker of bone formation) and pyridinoline cross-links (a marker of bone resorption) in ColI/Rs1-late mice. At 20 weeks, n = 8 mutants, 6 WT; at 55 to 60 weeks, n = 4 mutants, 4 WT. Values are mean ± 1 SD. a: p < .05 versus WT; b: p < .01 versus WT.
Fig. 6
Fig. 6
Representative µCT images of femora in longitudinal and transverse mid-diaphysis sections of age- and sex-matched mice show a delayed but gradual increase in trabecular bone and loss of cortical bone in the ColI/Rs1-late mice. Scale bar = 1 mm. Double fluorochrome labeling (middle panels) with calcein (green) and xylenol orange (orange) demonstrated disordered bone formation in the areas of increased trabecular bone. Scale bar = 10 µm. TRAP staining (pink), indicative of osteoclast-lineage cells, is increased within the regions of expanded trabecular bone in ColI/Rs1-late mice. Scale bar = 100 µm. Von Kossa staining shows the increased trabecular bone and loss of normal bone marrow cells (scale bar = 100 µm). c = cortical bone; t = trabecular bone; s = bone marrow space.
Fig. 7
Fig. 7
The Rs1-induced trabecular bone phenotype is reversible. (A, B) Representative longitudinal (A) and transverse (B) µCT images of femora from ColI/Rs1–4 week mice expressing Rs1 from gestation until 4 weeks of age, showing the loss of accumulated trabecular bone and return of the bone marrow space and cortical shell after Rs1 expression has been discontinued. A femur from a 20-week-old WT mouse is shown for comparison. t = trabecular bone; c = cortical bone; s = bone marrow space. Scale bar = 1 mm. (C) Fluorescent imaging of double-labeled bone showing the return of linear, orderly bone mineral apposition (green = calcein; orange = xylenol orange) similar to that seen in WT animals. Scale bar = 10 µm. (D) TRAP staining shows a significant decrease in osteoclast lineage cells (pink) as the trabecular bone overgrowth resolves. Scale bar = 100 µm. (E) von Kossa staining showing the return of normal-appearing trabeculi and bone marrow cells, similar to that seen in WT animals. Scale bar = 100 µm. (F) Rs1 expression levels in whole humeri isolated from ColI/Rs1–4 week mice shows rapid suppression after doxycycline is started at 4 weeks of age. Representative mice are shown for each timepoint. Values are mean ± 1 SD of technical triplicates. (G) Plots of whole-body BMD of six representative ColI/Rs1-4 week mice (colored lines) and one WT mouse (black, bottom line) indicate variation in the degree of bone accumulation at the start of the study at 4 weeks. All mutant mice showed decreases in their BMD after Rs1 expression was discontinued. At 4 weeks, mice were stratified into two groups: BMD < 3 SD above the average WT BMD (0.0521 g/cm2, as indicated by the dotted line; WT average = 0.0403 ± 0.0039 g/cm2) and BMD > 3 SD above the average WT BMD. Mice in group 2 were selected for pooled analysis in panel H. (H) Average whole-body BMD for group 2 mice (as determined in panel G) showed a continuous decline after Rs1 expression was discontinued. The number of animals meeting the criteria for group 2 at 4, 6, 9, 13, 18, 20, 25, and 30 weeks: WT: 16, 10, 9, 11, 12, 7, 4, and 4; ColI/Rs1–4 week: 7, 6, 5, 6, 10, 8, 6, and 5. Values are mean ± 1 SD. a: p < .05; b: p < .005; c: p < .001 versus WT.

Similar articles

Cited by

References

    1. National Osteoporosis Foundation. America's Bone Health: The State of Osteoporosis and Low Bone Mass in Our Nation. Washington: National Osteoporosis Foundation; 2002.
    1. MacKelvie KJ, Khan KM, Petit MA, Janssen PA, McKay HA. A school-based exercise intervention elicits substantial bone health benefits: a 2-year randomized controlled trial in girls. Pediatrics. 2003;112:e447. - PubMed
    1. Cooper C, Harvey N, Javaid K, Hanson M, Dennison E. Growth and bone development. Nestle Nutr Workshop Ser Pediatr Program. 2008;61:53–68. - PubMed
    1. Cooper C, Westlake S, Harvey N, Javaid K, Dennison E, Hanson M. Developmental origins of osteoporotic fracture. Osteoporos Int. 2006;17:337–347. - PubMed
    1. Aubin JE, Lian JB, Stein GS. Bone Formation: Maturation and Functional Activities of Osteoblast Lineage Cells. In: Favus MJ, editor. Primer on the Metabolic Bone Diseases and Disorders of Mineral Metabolism. 6th ed. Washington: American Society for Bone and Mineral Research; 2006. pp. 20–29.

Publication types

Substances