

Genetically determined phenotype covariation networks control bone strength
- PMID: 20200957
- PMCID: PMC3154000
- DOI: 10.1002/jbmr.41
Genetically determined phenotype covariation networks control bone strength
Abstract
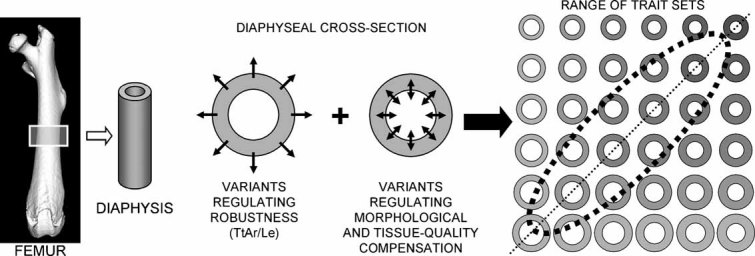
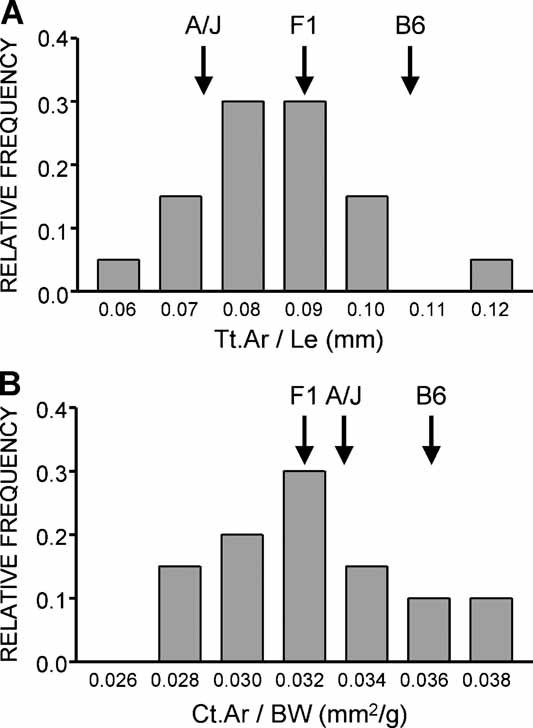
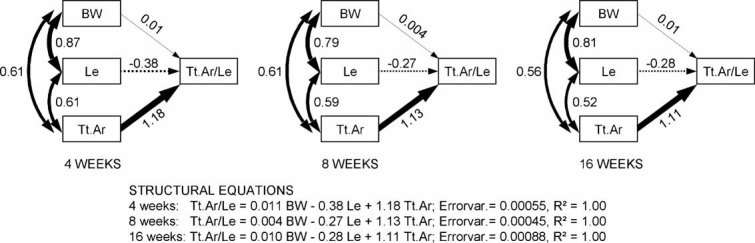
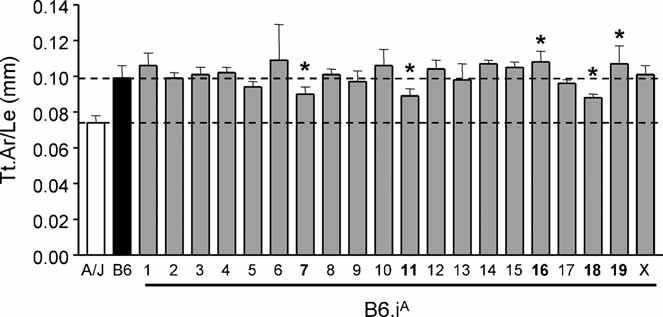
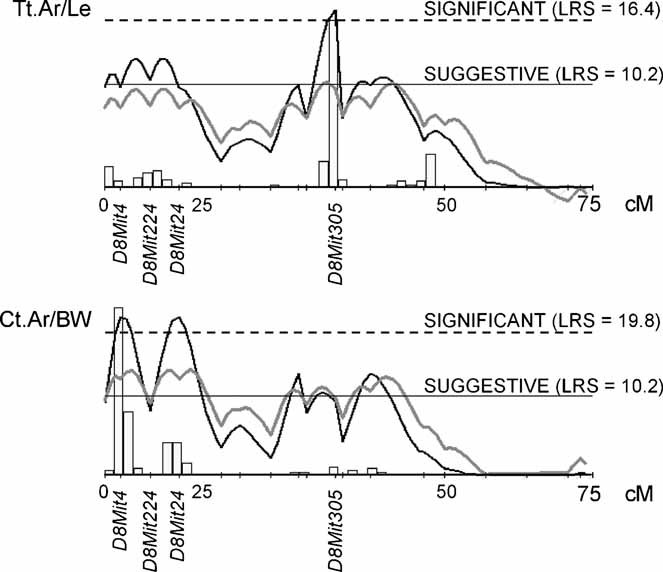
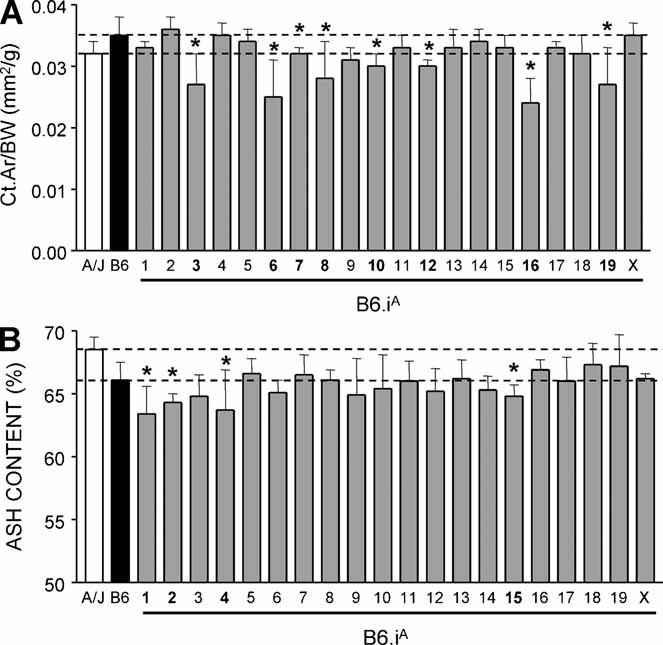
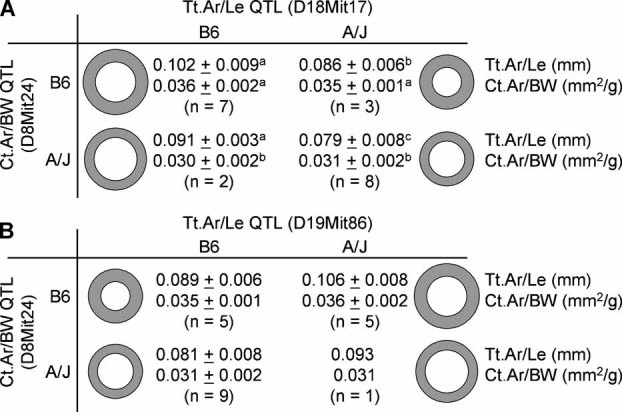
To identify genes affecting bone strength, we studied how genetic variants regulate components of a phenotypic covariation network that was previously shown to accurately characterize the compensatory trait interactions involved in functional adaptation during growth. Quantitative trait loci (QTLs) regulating femoral robustness, morphologic compensation, and mineralization (tissue quality) were mapped at three ages during growth using AXB/BXA Recombinant Inbred (RI) mouse strains and adult B6-i(A) Chromosome Substitution Strains (CSS). QTLs for robustness were identified on chromosomes 8, 12, 18, and 19 and confirmed at all three ages, indicating that genetic variants established robustness postnatally without further modification. A QTL for morphologic compensation, which was measured as the relationship between cortical area and body weight, was identified on chromosome 8. This QTL limited the amount of bone formed during growth and thus acted as a setpoint for diaphyseal bone mass. Additional QTLs were identified from the CSS analysis. QTLs for robustness and morphologic compensation regulated bone structure independently (ie, in a nonpleiotropic manner), indicating that each trait may be targeted separately to individualize treatments aiming to improve strength. Multiple regression analyses showed that variation in morphologic compensation and tissue quality, not bone size, determined femoral strength relative to body weight. Thus an individual inheriting slender bones will not necessarily inherit weak bones unless the individual also inherits a gene that impairs compensation. This systems genetic analysis showed that genetically determined phenotype covariation networks control bone strength, suggesting that incorporating functional adaptation into genetic analyses will advance our understanding of the genetic basis of bone strength.
2010 American Society for Bone and Mineral Research.
Figures
Similar articles
-
Genetic perturbations that impair functional trait interactions lead to reduced bone strength and increased fragility in mice.Bone. 2014 Oct;67:130-8. doi: 10.1016/j.bone.2014.06.035. Epub 2014 Jul 6. Bone. 2014. PMID: 25003813 Free PMC article.
-
Phenotypic integration among trabecular and cortical bone traits establishes mechanical functionality of inbred mouse vertebrae.J Bone Miner Res. 2009 Apr;24(4):606-20. doi: 10.1359/jbmr.081224. J Bone Miner Res. 2009. PMID: 19063678 Free PMC article.
-
Phenotypic integration of skeletal traits during growth buffers genetic variants affecting the slenderness of femora in inbred mouse strains.Mamm Genome. 2009 Jan;20(1):21-33. doi: 10.1007/s00335-008-9158-1. Epub 2008 Dec 5. Mamm Genome. 2009. PMID: 19082857 Free PMC article.
-
Functional interactions among morphologic and tissue quality traits define bone quality.Clin Orthop Relat Res. 2011 Aug;469(8):2150-9. doi: 10.1007/s11999-010-1706-9. Clin Orthop Relat Res. 2011. PMID: 21125361 Free PMC article. Review.
-
Systems analysis of bone.Wiley Interdiscip Rev Syst Biol Med. 2009 Jul-Aug;1(1):73-88. doi: 10.1002/wsbm.15. Wiley Interdiscip Rev Syst Biol Med. 2009. PMID: 20046860 Free PMC article. Review.
Cited by
-
Biological regulation of bone quality.Curr Osteoporos Rep. 2014 Sep;12(3):366-75. doi: 10.1007/s11914-014-0213-4. Curr Osteoporos Rep. 2014. PMID: 24894149 Free PMC article. Review.
-
Differential changes in bone strength of two inbred mouse strains following administration of a sclerostin-neutralizing antibody during growth.PLoS One. 2019 Apr 4;14(4):e0214520. doi: 10.1371/journal.pone.0214520. eCollection 2019. PLoS One. 2019. PMID: 30947279 Free PMC article.
-
Systematic evaluation of skeletal mechanical function.Curr Protoc Mouse Biol. 2013 Jun;3:39-67. doi: 10.1002/9780470942390.mo130027. Curr Protoc Mouse Biol. 2013. PMID: 24634803 Free PMC article.
-
Femoral Neck External Size but not aBMD Predicts Structural and Mass Changes for Women Transitioning Through Menopause.J Bone Miner Res. 2017 Jun;32(6):1218-1228. doi: 10.1002/jbmr.3082. Epub 2017 Jan 30. J Bone Miner Res. 2017. PMID: 28084657 Free PMC article.
-
Hdac3 regulates bone modeling by suppressing osteoclast responsiveness to RANKL.J Biol Chem. 2020 Dec 18;295(51):17713-17723. doi: 10.1074/jbc.RA120.013573. J Biol Chem. 2020. PMID: 33454009 Free PMC article.
References
-
- Ralston SH. Genetics of osteoporosis. Proc Nutr Soc. 2007;66:158–165. - PubMed
-
- Xiong Q, Han C, Beamer WG, Gu W. A close examination of genes within quantitative trait loci of bone mineral density in whole mouse genome. Crit Rev Eukaryot Gene Expr. 2008;18:323–343. - PubMed
-
- Chen Y, Shen H, Yang F, et al. Choice of study phenotype in osteoporosis genetic research. J Bone Miner Metab. 2009;27:121–126. - PubMed
-
- Ruff C, Holt B, Trinkaus E. Who's afraid of the big bad Wolff? “Wolff's law” and bone functional adaptation. Am J Phys Anthropol. 2006;129:484–498. - PubMed
Publication types
MeSH terms
Grants and funding
LinkOut - more resources
Full Text Sources
Molecular Biology Databases
