

A key role for membrane transporter NKCC1 in mediating chondrocyte volume increase in the mammalian growth plate
- PMID: 20200963
- PMCID: PMC3154001
- DOI: 10.1002/jbmr.47
A key role for membrane transporter NKCC1 in mediating chondrocyte volume increase in the mammalian growth plate
Abstract
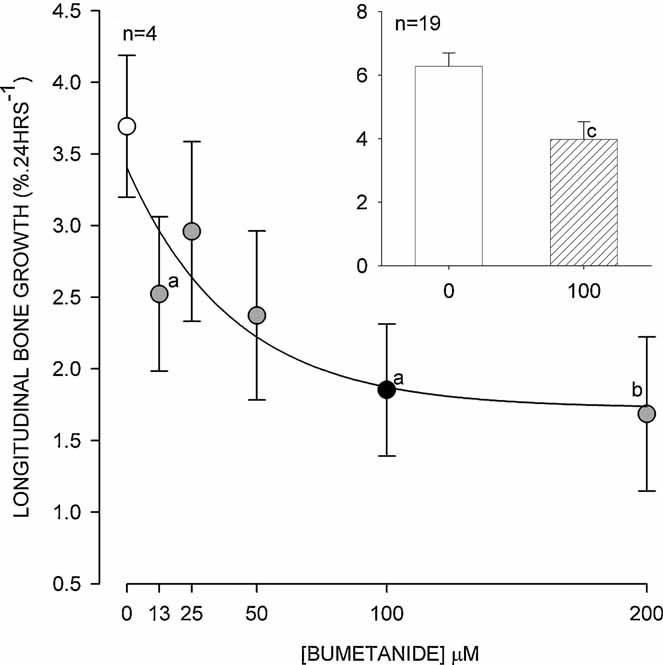
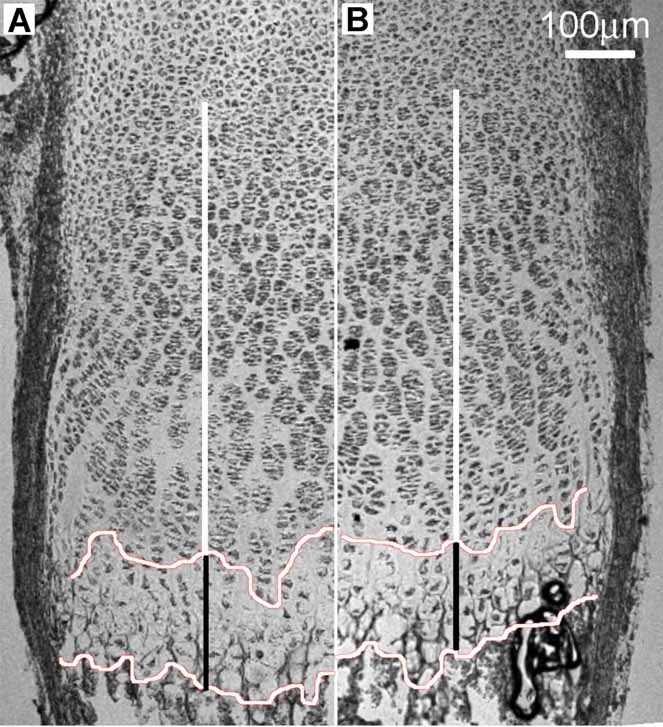
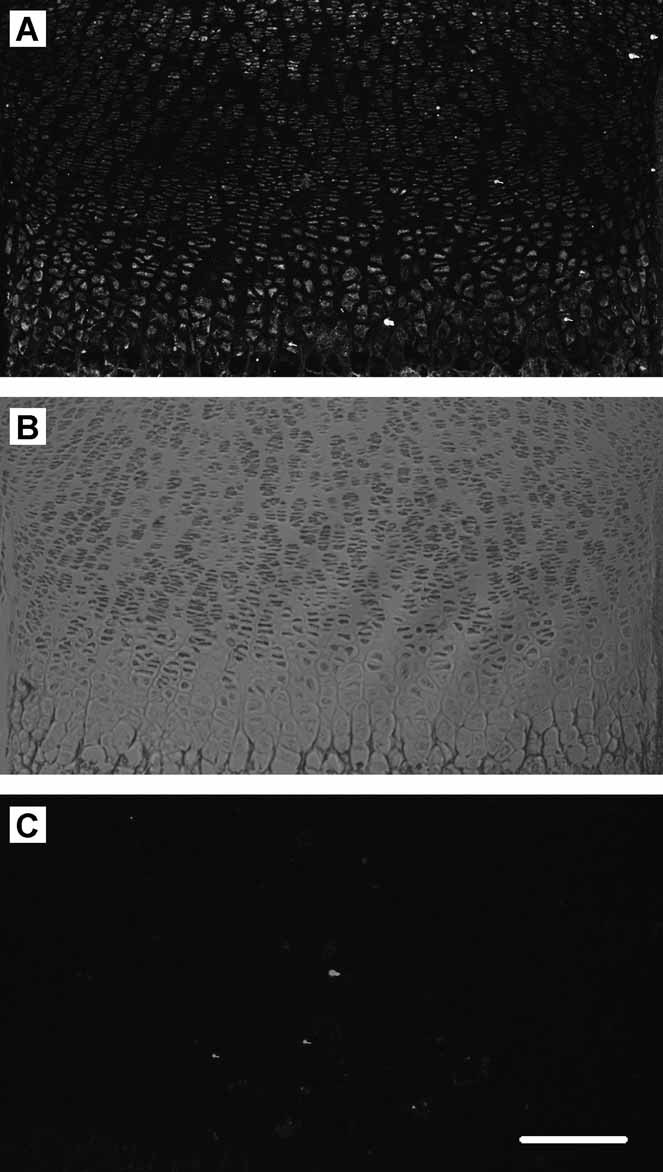
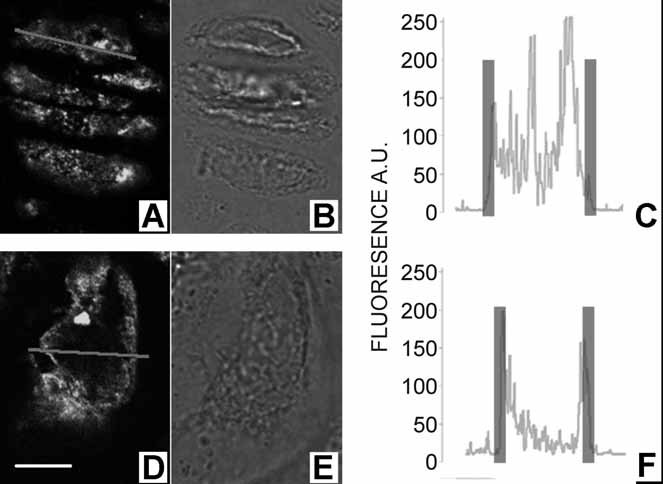
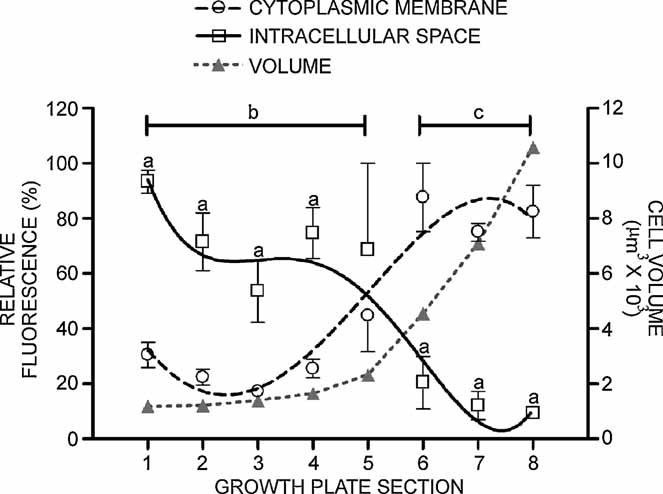
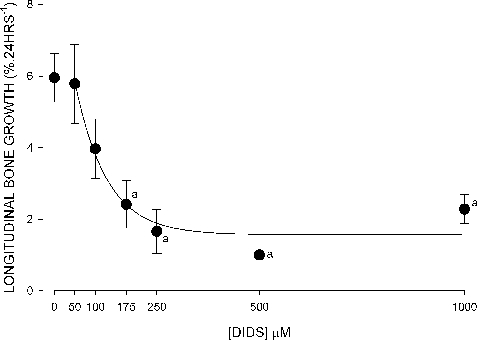
The mechanisms that underlie growth plate chondrocyte volume increase and hence bone lengthening are poorly understood. Many cell types activate the Na-K-Cl cotransporter (NKCC) to bring about volume increase. We hypothesised that NKCC may be responsible for the volume expansion of hypertrophic chondrocytes. Metatarsals/metacarpals from 16 rat pups (P(7)) were incubated in the presence/absence of the specific NKCC inhibitor bumetanide and measurement of whole-bone lengths and histologic analysis of the growth plate were done after 24 hours. Fluorescent NKCC immunohistochemistry was visualised using a confocal laser scanning microscopy on seven rat tibial growth plates (P(7)). Microarray analysis was performed on mRNA isolated from proliferative and hypertrophic zone cells of tibial growth plates from five rats of each of three ages (P(49/53/58)). Exposure to bumetanide resulted in approximately 35% reduction (paired Student's t test, p < .05) of bone growth in a dose-dependent manner; histologic analysis showed that a reduction in hypertrophic zone height was responsible. Quantification of fluorescence immunohistochemistry revealed a significant (paired Student's t test, p < .05) change in NKCC from the intracellular space of proliferative cells to the cytosolic membrane of hypertrophic zone cells. Further, microarray analysis illustrated an increase in NKCC1 mRNA between proliferative and hypertrophic cells. The increase in NKCC1 mRNA in hypertrophic zone cells, its cellular localization, and reduced bone growth in the presence of the NKCC inhibitor bumetanide implicate NKCC in growth plate hypertrophic chondrocyte volume increase. Further investigation is warranted to determine the regulatory control of NKCC in the mammalian growth plate and the possible detrimental effect on bone growth with chronic exposure to loop diuretics.
2010 American Society for Bone and Mineral Research.
Figures
Similar articles
-
Expression of the sodium potassium chloride cotransporter (NKCC1) and sodium chloride cotransporter (NCC) and their effects on rat lens transparency.Mol Vis. 2010 May 4;16:800-12. Mol Vis. 2010. PMID: 20458365 Free PMC article.
-
Role of NKCC in BK channel-mediated net K⁺ secretion in the CCD.Am J Physiol Renal Physiol. 2011 Nov;301(5):F1088-97. doi: 10.1152/ajprenal.00347.2011. Epub 2011 Aug 3. Am J Physiol Renal Physiol. 2011. PMID: 21816753 Free PMC article.
-
Suppression of mammalian bone growth by membrane transport inhibitors.J Cell Biochem. 2013 Mar;114(3):658-68. doi: 10.1002/jcb.24408. J Cell Biochem. 2013. PMID: 23059814
-
The role of Na-K-Cl co-transporter in cerebral ischemia.Neurol Res. 2005 Apr;27(3):280-6. doi: 10.1179/016164105X25243. Neurol Res. 2005. PMID: 15845211 Review.
-
New insights into function of the growth plate: clinical observations, chondrocyte enlargement and a possible role for membrane transporters.J Bone Joint Surg Br. 2008 Dec;90(12):1541-7. doi: 10.1302/0301-620X.90B12.20805. J Bone Joint Surg Br. 2008. PMID: 19043122 Review.
Cited by
-
WNK1-OSR1 kinase-mediated phospho-activation of Na+-K+-2Cl- cotransporter facilitates glioma migration.Mol Cancer. 2014 Feb 20;13:31. doi: 10.1186/1476-4598-13-31. Mol Cancer. 2014. PMID: 24555568 Free PMC article.
-
Effects of growth hormone treatment on growth plate, bone, and mineral metabolism of young rats with uremia induced by adenine.Pediatr Res. 2017 Jul;82(1):148-154. doi: 10.1038/pr.2017.95. Epub 2017 Apr 26. Pediatr Res. 2017. PMID: 28376076
-
Benzamil sensitive ion channels contribute to volume regulation in canine chondrocytes.Br J Pharmacol. 2013 Apr;168(7):1584-96. doi: 10.1111/j.1476-5381.2012.02185.x. Br J Pharmacol. 2013. PMID: 22928819 Free PMC article.
-
Structural clues to articular calcified cartilage function: A descriptive review of this crucial interface tissue.J Anat. 2022 Oct;241(4):875-895. doi: 10.1111/joa.13728. Epub 2022 Jul 22. J Anat. 2022. PMID: 35866709 Free PMC article. Review.
-
A patient with multisystem dysfunction carries a truncation mutation in human SLC12A2, the gene encoding the Na-K-2Cl cotransporter, NKCC1.Cold Spring Harb Mol Case Stud. 2016 Nov;2(6):a001289. doi: 10.1101/mcs.a001289. Cold Spring Harb Mol Case Stud. 2016. PMID: 27900370 Free PMC article.
References
-
- Wilsman NJ, Farnum CE, Leiferman EM, Fry M, Barreto C. Differential growth by growth plates as a function of multiple parameters of chondrocytic kinetics. J Orthop Res. 1996;14:927–936. - PubMed
-
- Bush PG, Parisinos CA, Hall AC. The osmotic sensitivity of rat growth plate chondrocytes in situ: clarifying the mechanisms of hypertrophy. J Cell Physiol. 2008;214:621–629. - PubMed
-
- Buckwalter JA, Mower D, Ungar R, Schaeffer J, Ginsberg B. Morphometric analysis of chondrocyte hypertrophy. J Bone Joint Surg. 1986;68A:243–255. - PubMed
-
- Haussinger D, Roth E, Lang F, Gerok W. Cellular hydration state: an important determinant of protein catabolism in health and disease. Lancet. 1993;341:1330–1332. - PubMed
-
- Farnum CE, Lee R, O'Hara K, Urban JPG. Volume increase in growth plate chondrocytes during hypertrophy: the contribution of organic osmolytes. Bone. 2002;30:574–581. - PubMed
