Microindentation for in vivo measurement of bone tissue mechanical properties in humans
- PMID: 20200991
- PMCID: PMC3153354
- DOI: 10.1002/jbmr.73
Microindentation for in vivo measurement of bone tissue mechanical properties in humans
Abstract
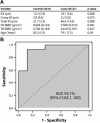
Bone tissue mechanical properties are deemed a key component of bone strength, but their assessment requires invasive procedures. Here we validate a new instrument, a reference point indentation (RPI) instrument, for measuring these tissue properties in vivo. The RPI instrument performs bone microindentation testing (BMT) by inserting a probe assembly through the skin covering the tibia and, after displacing periosteum, applying 20 indentation cycles at 2 Hz each with a maximum force of 11 N. We assessed 27 women with osteoporosis-related fractures and 8 controls of comparable ages. Measured total indentation distance (46.0 +/- 14 versus 31.7 +/- 3.3 microm, p = .008) and indentation distance increase (18.1 +/- 5.6 versus 12.3 +/- 2.9 microm, p = .008) were significantly greater in fracture patients than in controls. Areas under the receiver operating characteristic (ROC) curve for the two measurements were 93.1% (95% confidence interval [CI] 83.1-100) and 90.3% (95% CI 73.2-100), respectively. Interobserver coefficient of variation ranged from 8.7% to 15.5%, and the procedure was well tolerated. In a separate study of cadaveric human bone samples (n = 5), crack growth toughness and indentation distance increase correlated (r = -0.9036, p = .018), and scanning electron microscope images of cracks induced by indentation and by experimental fractures were similar. We conclude that BMT, by inducing microscopic fractures, directly measures bone mechanical properties at the tissue level. The technique is feasible for use in clinics with good reproducibility. It discriminates precisely between patients with and without fragility fracture and may provide clinicians and researchers with a direct in vivo measurement of bone tissue resistance to fracture.
Figures


Similar articles
-
True Gold or Pyrite: A Review of Reference Point Indentation for Assessing Bone Mechanical Properties In Vivo.J Bone Miner Res. 2015 Sep;30(9):1539-50. doi: 10.1002/jbmr.2603. Epub 2015 Aug 6. J Bone Miner Res. 2015. PMID: 26235703 Free PMC article. Review.
-
The inferomedial femoral neck is compromised by age but not disease: Fracture toughness and the multifactorial mechanisms comprising reference point microindentation.J Mech Behav Biomed Mater. 2017 Nov;75:399-412. doi: 10.1016/j.jmbbm.2017.06.036. Epub 2017 Jun 30. J Mech Behav Biomed Mater. 2017. PMID: 28803114 Free PMC article.
-
Microstructural and compositional contributions towards the mechanical behavior of aging human bone measured by cyclic and impact reference point indentation.Bone. 2016 Jun;87:37-43. doi: 10.1016/j.bone.2016.03.013. Epub 2016 Mar 26. Bone. 2016. PMID: 27021150 Free PMC article.
-
Insights into reference point indentation involving human cortical bone: sensitivity to tissue anisotropy and mechanical behavior.J Mech Behav Biomed Mater. 2014 Sep;37:174-85. doi: 10.1016/j.jmbbm.2014.05.016. Epub 2014 May 27. J Mech Behav Biomed Mater. 2014. PMID: 24929851 Free PMC article.
-
Added Value of Impact Microindentation in the Evaluation of Bone Fragility: A Systematic Review of the Literature.Front Endocrinol (Lausanne). 2020 Feb 7;11:15. doi: 10.3389/fendo.2020.00015. eCollection 2020. Front Endocrinol (Lausanne). 2020. PMID: 32117052 Free PMC article.
Cited by
-
True Gold or Pyrite: A Review of Reference Point Indentation for Assessing Bone Mechanical Properties In Vivo.J Bone Miner Res. 2015 Sep;30(9):1539-50. doi: 10.1002/jbmr.2603. Epub 2015 Aug 6. J Bone Miner Res. 2015. PMID: 26235703 Free PMC article. Review.
-
The contribution of the extracellular matrix to the fracture resistance of bone.Curr Osteoporos Rep. 2012 Jun;10(2):169-77. doi: 10.1007/s11914-012-0101-8. Curr Osteoporos Rep. 2012. PMID: 22527725 Free PMC article. Review.
-
Reference-point indentation correlates with bone toughness assessed using whole-bone traditional mechanical testing.Bone. 2013 Mar;53(1):301-5. doi: 10.1016/j.bone.2012.12.015. Epub 2012 Dec 27. Bone. 2013. PMID: 23274349 Free PMC article.
-
Increasing fluoride content deteriorates rat bone mechanical properties.Bone. 2020 Jul;136:115369. doi: 10.1016/j.bone.2020.115369. Epub 2020 Apr 19. Bone. 2020. PMID: 32320892 Free PMC article.
-
Bone tissue quality in patients with monoclonal gammopathy of uncertain significance.J Bone Miner Metab. 2020 Jul;38(4):563-569. doi: 10.1007/s00774-020-01084-3. Epub 2020 Jan 23. J Bone Miner Metab. 2020. PMID: 31974675
References
-
- Ettinger MP. Aging bone and osteoporosis: strategies for preventing fractures in the elderly. Arch Intern Med. 2003;163:2237–2246. - PubMed
-
- NIH. Consensus Development Panel on Osteoporosis Prevention, Diagnosis, and Therapy. JAMA. 2001;285:785–795. - PubMed
-
- Rivadeneira F, Zillikens MC, Laet CED, et al. Femoral neck BMD is a strong predictor of hip fracture susceptibility in elderly men and women because it detects cortical bone instability: the Rotterdam Study. J Bone Miner Res. 2007;22:1781–1790. - PubMed
-
- Cummings SR, Karpf DB, Harris F, et al. Improvement in spine bone density and reduction in risk of vertebral fractures during treatment with antiresorptive drugs. Am J Med. 2002;112:281–289. - PubMed

