

A systems biology approach to understanding atherosclerosis
- PMID: 20201031
- PMCID: PMC2992755
- DOI: 10.1002/emmm.201000063
A systems biology approach to understanding atherosclerosis
Abstract
Atherosclerosis, a chronic inflammatory disease of the vascular system, presents significant challenges to developing effective molecular diagnostics and novel therapies. A systems biology approach integrating data from large-scale measurements (e.g. transcriptomics, proteomics and genomics) is successfully contributing to deciphering regulatory networks underlying the response of many different cellular systems to perturbations. Such a network analysis strategy using pathway information and data from multiple measurement platforms, tissues and species is a promising approach to elucidate the mechanistic underpinnings of complex diseases. Here, we present our views on the contributions that a systems approach can bring to the study of atherosclerosis, propose ways to tackle the complexity of the disease in a systems manner and review recent systems-level studies of the disease.
Figures
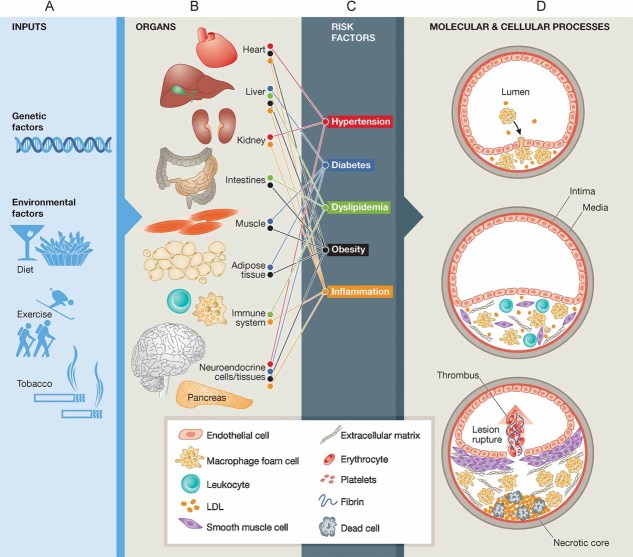
Genetic and environmental factors.
Multiple organs and organ systems are involved in the disease process.
Risk factors that are influenced by genetic and environmental inputs and that involve multiple organ systems contribute to the development and progression of atherosclerosis.
Atherosclerosis progresses through several stages, each of which involves the interaction of multiple cell types and molecular processes.
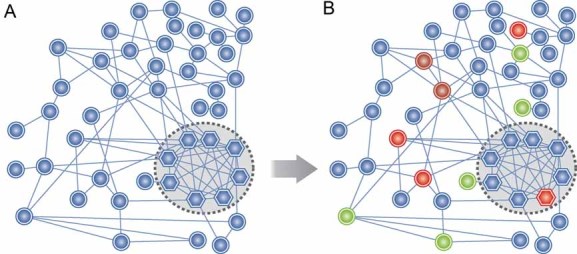
In a systems biology approach, the goal is to uncover a network of molecular interactions whose altered state can be correlated with disease progression. In this simple conceptual network diagram, a node (biomolecule) is represented by a circle or hexagon, and an interaction between two nodes (edges) is represented by a line between them. A highly interconnected subnetwork of molecules (hexagons, inside dotted circle region) is shown.
Colored nodes denote changes in the network during disease progression (a red node denotes increased expression and green denotes decreased expression).
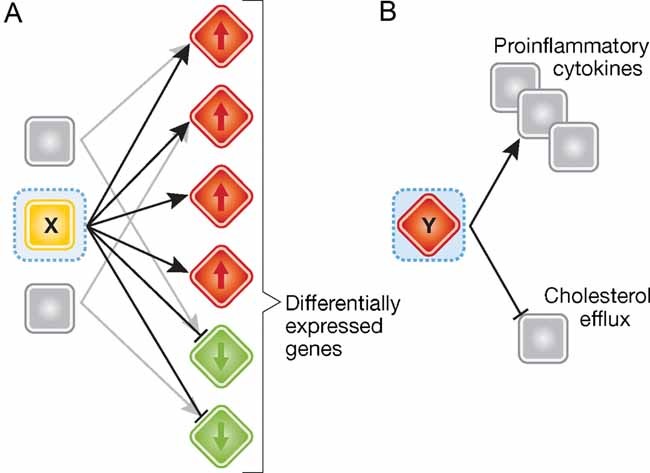
A regulatory molecule ‘X’ that is not differentially expressed can be implicated by its connectivity to differentially expressed molecules, in the interaction network.
A differentially expressed molecule ‘Y’ can be identified as a key regulator through its connections to key disease-associated molecules and biological processes. Red/green colours denote up/downregulation of mRNA.
References
-
- Affymetrix I. Guide to Probe Logarithmic Intensity Error (PLIER) Estimation. Technical Note. Santa Clara, CA: Affymetrix; 2005.
-
- Alon U. An Introduction to Systems Biology. Boca Raton, FL: Chapman & Hall/CRC; 2007.
-
- Ashley EA, Ferrara R, King JY, Vailaya A, Kuchinsky A, He X, Byers B, Gerckens U, Oblin S, Tsalenko A, et al. Network analysis of human in-stent restenosis. Circulation. 2006;114:2644–2654. - PubMed
-
- Assmann G, Cullen P, Jossa F, Lewis B, Mancini M. Coronary heart disease: reducing the risk: the scientific background to primary and secondary prevention of coronary heart disease. A worldwide view. International Task force for the Prevention of Coronary Heart disease. Arterioscler Thromb Vasc Biol. 1999;19:1819–1824. - PubMed
Publication types
MeSH terms
Grants and funding
LinkOut - more resources
Full Text Sources
Other Literature Sources
Medical
