

Stat5 is indispensable for the maintenance of bcr/abl-positive leukaemia
- PMID: 20201032
- PMCID: PMC2906698
- DOI: 10.1002/emmm.201000062
Stat5 is indispensable for the maintenance of bcr/abl-positive leukaemia
Abstract
Tumourigenesis caused by the Bcr/Abl oncoprotein is a multi-step process proceeding from initial to tumour-maintaining events and finally results in a complex tumour-supporting network. A key to successful cancer therapy is the identification of critical functional nodes in an oncogenic network required for disease maintenance. So far, the transcription factors Stat3 and Stat5a/b have been implicated in bcr/abl-induced initial transformation. However, to qualify as a potential drug target, a signalling pathway must be required for the maintenance of the leukaemic state. Data on the roles of Stat3 or Stat5a/b in leukaemia maintenance are elusive. Here, we show that both, Stat3 and Stat5 are necessary for initial transformation. However, Stat5- but not Stat3-deletion induces G(0)/G(1) cell cycle arrest and apoptosis of imatinib-sensitive and imatinib-resistant stable leukaemic cells in vitro. Accordingly, Stat5-abrogation led to effective elimination of myeloid and lymphoid leukaemia maintenance in vivo. Hence, we identified Stat5 as a vulnerable point in the oncogenic network downstream of Bcr/Abl representing a case of non-oncogene addiction (NOA).
Figures
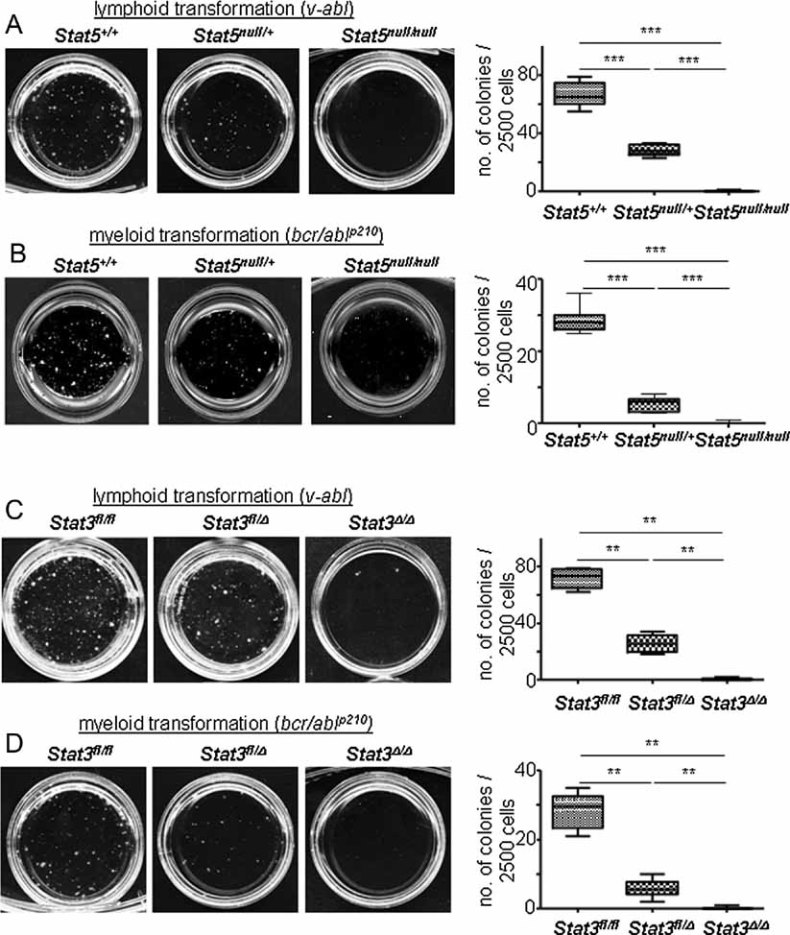
A, B. V-abl (A) and bcr/ablp210 (B)-induced transformation of Stat5+/+, Stat5null/+ and Stat5null/null FL cells in growth factor-free methylcellulose. One representative set of n = 4 for each genotype is depicted. Numbers of factor-independent v-abl+ and bcr/ablp210+ Stat5null/+ and Stat5null/null colonies were reduced compared to wt (2.4- and 400-fold for v-abl, 5.4- and 172-fold for bcr/ablp210, respectively).
C, D. V-abl (C) and bcr/ablp210 (D)-induced transformation of Stat3fl/fl, Stat3fl/Δ and Stat3Δ/Δ BM cells in growth factor-free methylcellulose (n = 3 for each genotype). Numbers of factor-independent v-abl+ and bcr/ablp210+ Stat3fl/Δ and Stat3Δ/Δ colonies were reduced compared to wt (2.4- and 105-fold for v-abl, 4.8- and 85-fold for bcr/ablp210, respectively). Data are summarized in box blots (right panel) and represent means ± SD.
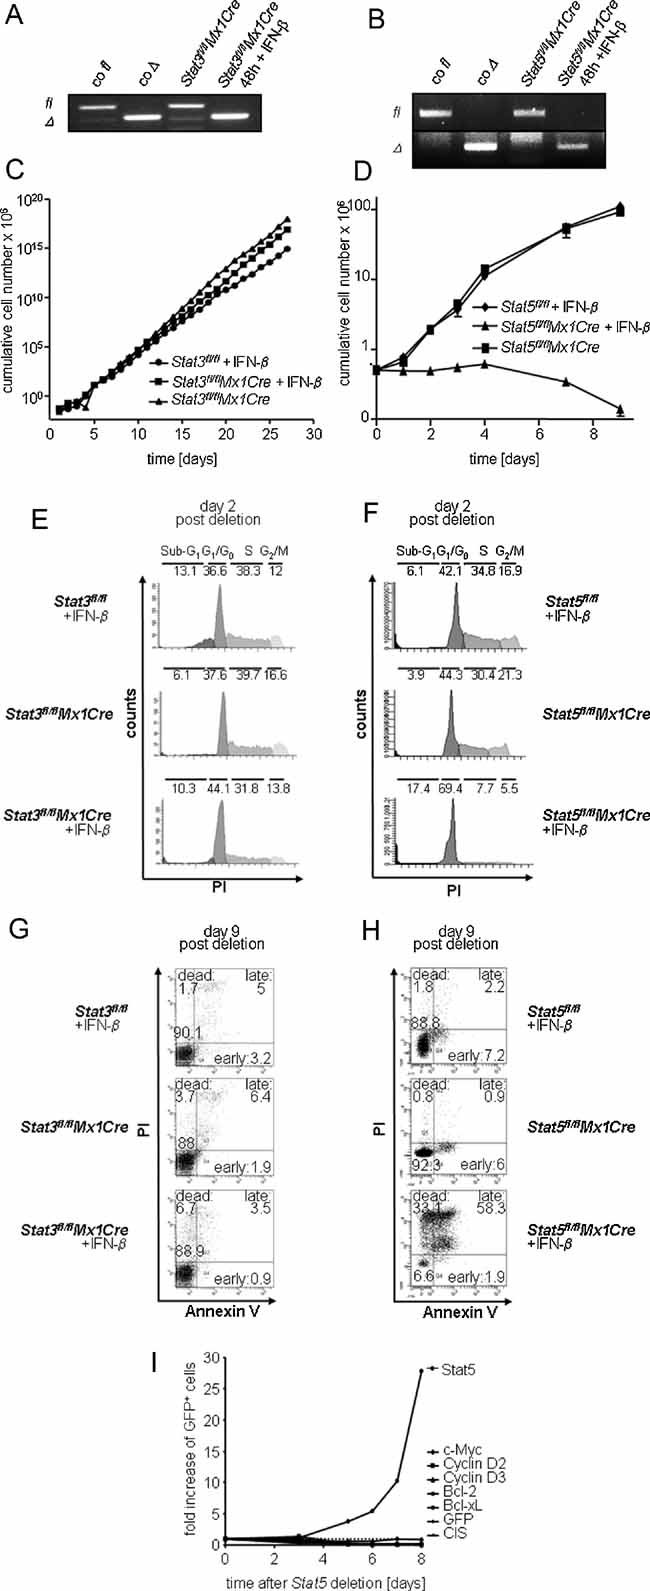
A, B. PCR analysis of gene deletion after IFN-β treatment. Deletion efficiency was determined by a PCR for floxed (fl) and deleted (Δ) Stat3 (A) and Stat5 (B) alleles 48 h after IFN-β treatment.
C, D. Effect of Stat5 or Stat3 deletion on cell proliferation in vitro. (C) Stat3fl/flMx1Cre cell lines were either treated with 1000U IFN-β or mock-treated (n = 3 each). Stat3fl/fl cell lines were used as a control (n = 3). (D) Stat5fl/flMx1Cre cell lines (n = 3 each) were treated analogously to (C).
E–H. Cell cycle and apoptosis analysis of IFN-β treated v-abl-transformed cell lines, 2 and 9 days after IFN-β treatment, respectively. Deletion of Stat5 induces a cell cycle arrest (F) and apoptosis (H), while deletion of Stat3 has no significant effect on evaluated parameters (E, G). Numbers show percentages of cells in indicated cell cycle phases (E, F) or in different stages of apoptosis (G, H). Re-expression of Stat5 target genes (D-type cyclins, c-myc, bcl-xL or bcl-2) failed to rescue Stat5-deficiency (I).
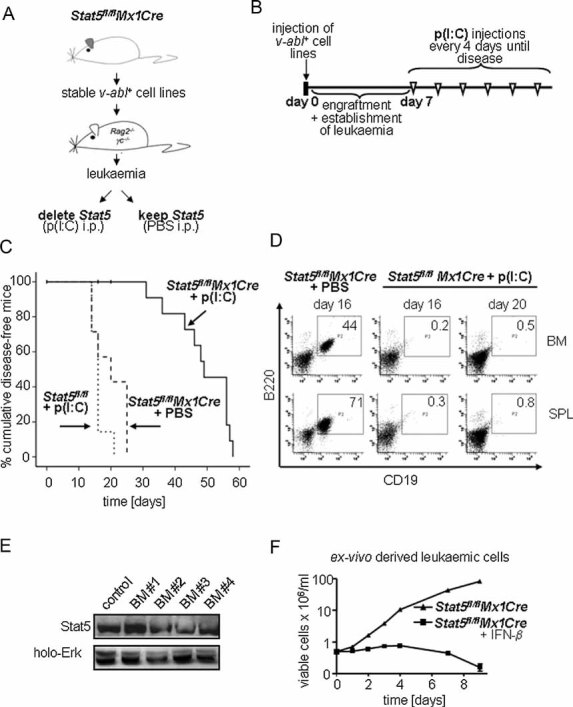
Scheme of the transplantation experiment. V-abl-transformed cell lines from BM of Stat5fl/flMx1Cre mice were transplanted into Rag2−/−γc−/− mice that were then treated with p(I:C) or PBS.
Time course of p(I:C) injections. Seven days after transplantation mice were injected i.p. with 400 µg p(I:C) every 4 days until the mice appeared moribund.
Transplantation of Stat5fl/flMx1Cre and Stat5fl/fl cell lines (n = 3 each) into Rag2−/−γc−/− mice. Kaplan–Meier analysis reveals a statistically significant difference in survival after Stat5-deletion (p < 0.001 for Stat5fl/flMx1Cre + p(I:C) (n = 14) versus Stat5fl/flMx1Cre + PBS (n = 7) and p > 0.05 for Stat5fl/flMx1Cre + PBS versus Stat5fl/fl + p(I:C) (n = 7)). Vertical bars indicate censored events.
Presence of transplanted leukaemic precursor B-cells (B220+CD19+) in BM and spleens of p(I:C)- and PBS-treated mice at indicated time points. Numbers in boxes indicate percentages of leukaemic cells.
Immunoblot analysis of ex vivo derived BM cells from p(I:C)-treated Stat5fl/flMx1Cre diseased mice for the presence of Stat5. Four representative samples are shown.
Ex vivo derived cell lines are sensitive to a secondary deletion of Stat5 by IFN-β. Cell numbers were determined by Trypan-blue exclusion.
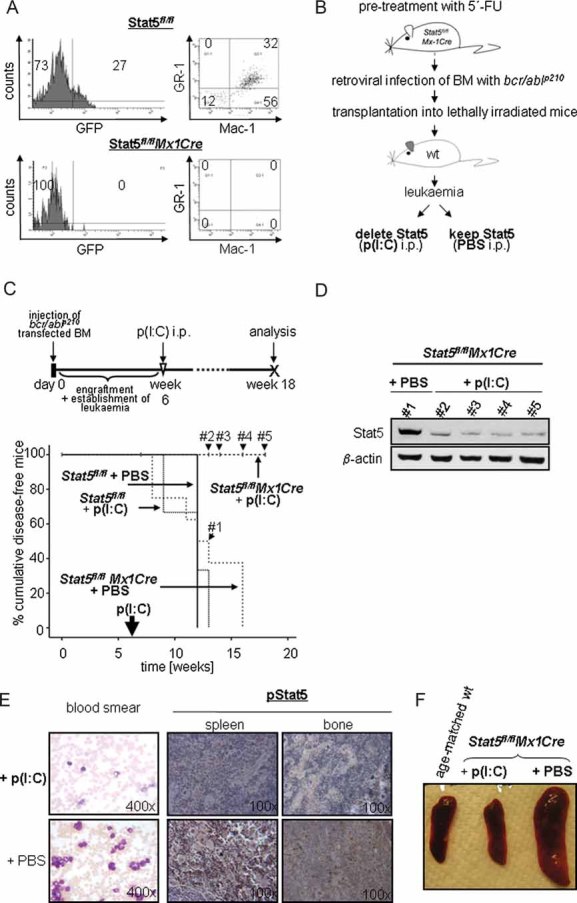
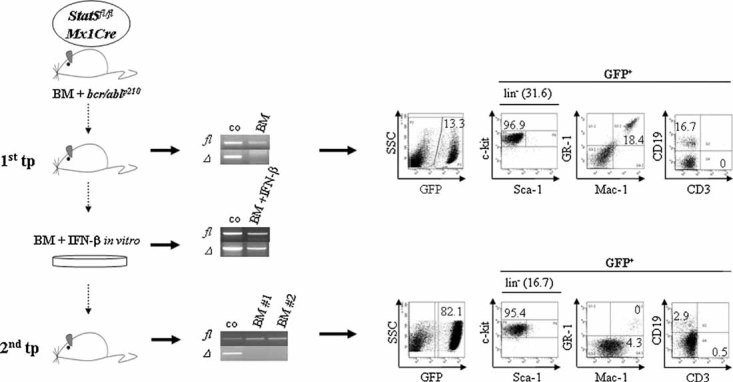
FACS analysis of BM cells 10 days after a single p(I:C) treatment. Six weeks post-transplantation of Stat5fl/fl or Stat5fl/flMx1Cre bcr/abl+/GFP+ cells, mice received p(I:C) i.p.
Experimental setup for the deletion of Stat5 in myeloid leukaemia.
Kaplan–Meier plot displaying overall survival of p(I:C)-treated and control recipient mice harbouring Stat5fl/flMx1Cre and Stat5fl/fl myeloid leukaemia. One single p(I:C) treatment was performed 6 weeks after transplantation in order to delete Stat5 in leukaemic cells. At the time point of analysis (18 weeks post-injection), 100% (10/10) of Stat5fl/flMx1Cre p(I:C)-treated mice are alive, while recipients from all other groups succumb to leukaemia (n = 8 for Stat5fl/flMx1Cre + PBS, n = 3 for Stat5fl/fl + p(I:C) and n = 3 for Stat5fl/fl + PBS; p < 0.001; mean survival time of 12.5, 11.3 and 12 weeks, respectively).
Immunoblot analysis of Stat5 expression in peripheral blood cells 7 (#1), 8 (#2), 10 (#3) and 12 (#4) weeks after p(I:C) treatment. These censored events are indicated in (C).
Blood smears and histological sections of spleens and BM. Treatment with p(I:C) leads to a massive reduction of WBCs (left panel) and phospho-Stat5 expression (right panels) in Stat5fl/flMx1Cre–bcr/ablp210+ transplanted mice compared to controls (PBS).
Macroscopic anatomy of spleens from Stat5fl/flMx1Cre mice treated with p(I:C) and control mice. A spleen of one age-matched healthy wt mouse is depicted as control.
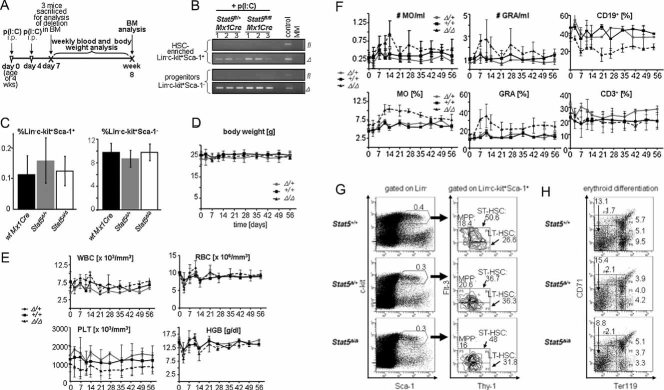
Time course of p(I:C) injections and analysis of mice during 8 weeks (n = 7/group).
Lin−c-kit+Sca-1+ (HSC-enriched population) and Lin−c-kit+Sca-1− (include myeloid and lymphoid progenitors) cells were purified by FACS-sorting and the deletion efficiency was determined by PCR. Numbers indicate samples from individual mice.
Bar graphs summarize the quantifications of Lin−c-kit+Sca-1+ (left panel) and Lin−c-kit+Sca-1− cells (right panel) as a percentage of total BM cells. Data are means ± SD.
Variation of body mass during 8 weeks after p(I:C) treatment. Data are means ± SD.
Blood count analysis during 8 weeks after p(I:C) treatment (WBC, white blood cells; RBC, red blood cells; PLT, platelets; HGB, haemoglobin). Data are means ± SD.
FACS-analysis of blood cell populations (differential) from indicated mouse genotypes (MO, monocytes; GRA, granulocytes; CD19+, CD19 positive B-cells; CD3+, CD3 positive T-cells). Data are means ± SD.
FACS analysis of HSC-subpopulations (LT-HSCs, ST-HSCs and MPPs) in the BM of p(I:C)-treated mice. Percentages are depicted in gates (n = 4).
FACS analysis of erythroid development in the BM of mice with indicated Stat5-status after p(I:C)-treatment. Numbers are relative percentages of cells in gates (n = 4).
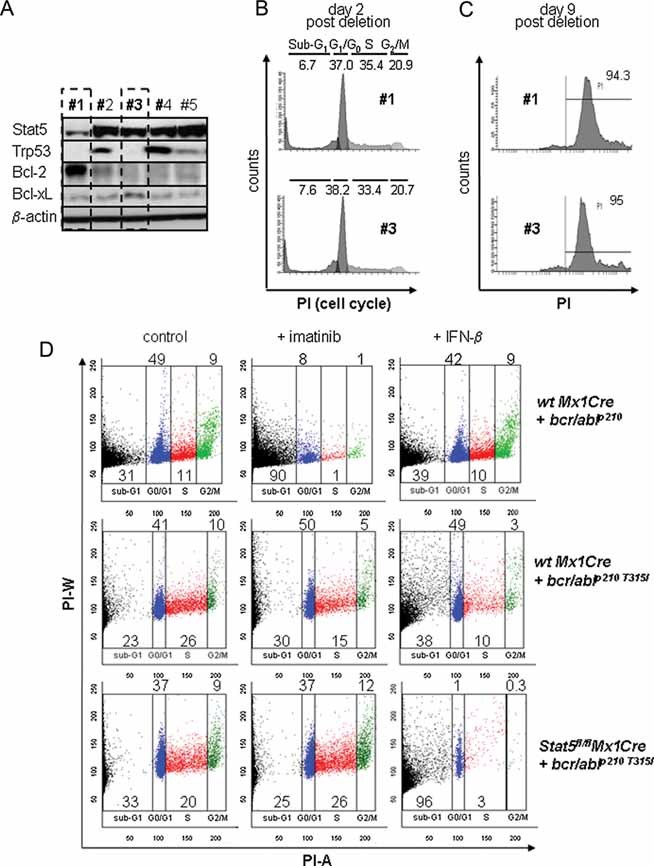
Immunoblot analysis of long-term cultured (14 months) Stat5fl/flMx1Cre v-abl+ cell lines for Stat5, Trp53, Bcl-2 and BclXL protein expressions. Acquisition of secondary mutations leading to defective Trp53- and/or Bcl-2-expression in two cell lines is depicted.
Cell cycle analysis of two cell lines from (A) which were subjected to Stat5-deletion via IFN-β-treatment (#1, #3).
Stat5-deletion by IFN-β-administration suffices to induce apoptosis in secondarily mutated cell lines (#1 and #3). Percentages of apoptotic cells are determined by PI staining in a non-hypotonic buffer.
Stat5-deletion via IFN-β induced cell-death of imatinib-resistant bcr/ablp210T315I+ BM-derived cells. Five days after treatment, IFN-β (lower right panel)—but not imatinib (100 nM, lower middle panel)—induced apoptosis of Stat5fl/flMx1Cre bcr/ablp210T315I+ leukaemic cells. As a control, 100 nM imatinib is sufficient to eradicate wt Mx1Cre bcr/ablp210+ BM-derived cells (upper middle panel). Numbers show percentages of cells in indicated cell cycle phases.
References
-
- Benekli M, Baer MR, Baumann H, Wetzler M. Signal transducer and activator of transcription proteins in leukemias. Blood. 2003;101:2940–2954. - PubMed
-
- Buettner R, Mora LB, Jove R. Activated STAT signaling in human tumors provides novel molecular targets for therapeutic intervention. Clin Cancer Res. 2002;8:945–954. - PubMed
-
- Burchill MA, Goetz CA, Prlic M, O'Neil JJ, Harmon IR, Bensinger SJ, Turka LA, Brennan P, Jameson SC, Farrar MA. Distinct effects of STAT5 activation on CD4+ and CD8+ T cell homeostasis: development of CD4+CD25+ regulatory T cells versus CD8+ memory T cells. J Immunol. 2003;171:5853–5864. - PubMed
Publication types
MeSH terms
Substances
Grants and funding
LinkOut - more resources
Full Text Sources
Other Literature Sources
Medical
Molecular Biology Databases
Miscellaneous
