. 2010 May;40(5):1473-85.
doi: 10.1002/eji.200939741.

NTPDase1 governs P2X7-dependent functions in murine macrophages

Affiliations

NTPDase1 governs P2X7-dependent functions in murine macrophages

Sébastien A Lévesque et al. Eur J Immunol. 2010 May.

Abstract

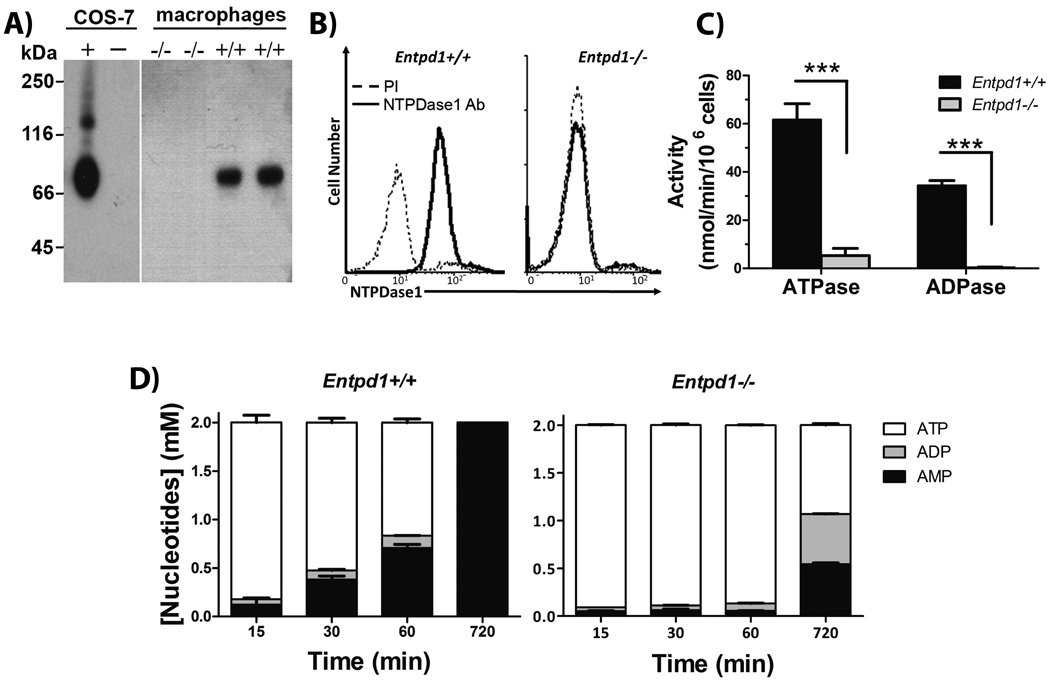
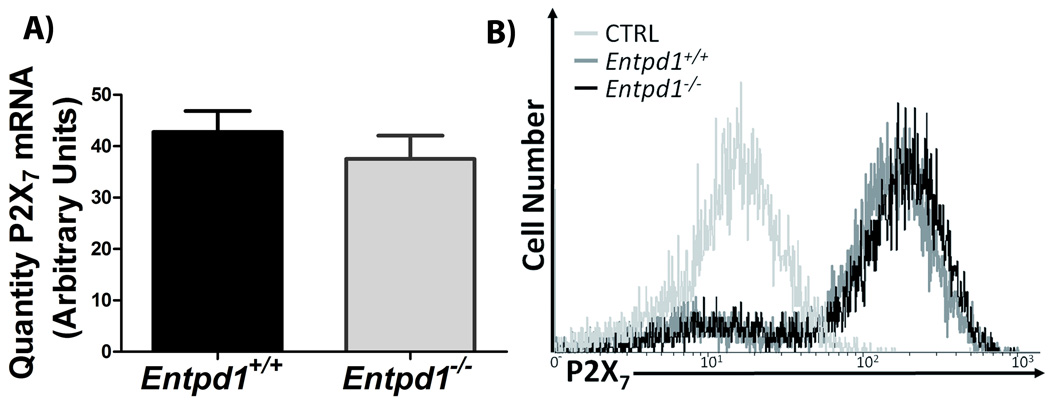
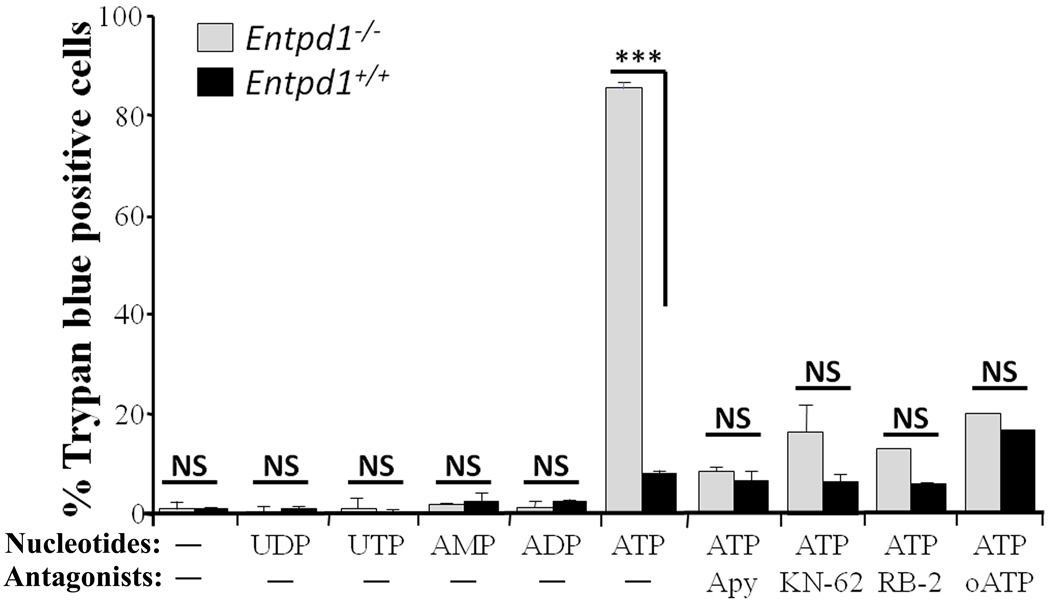
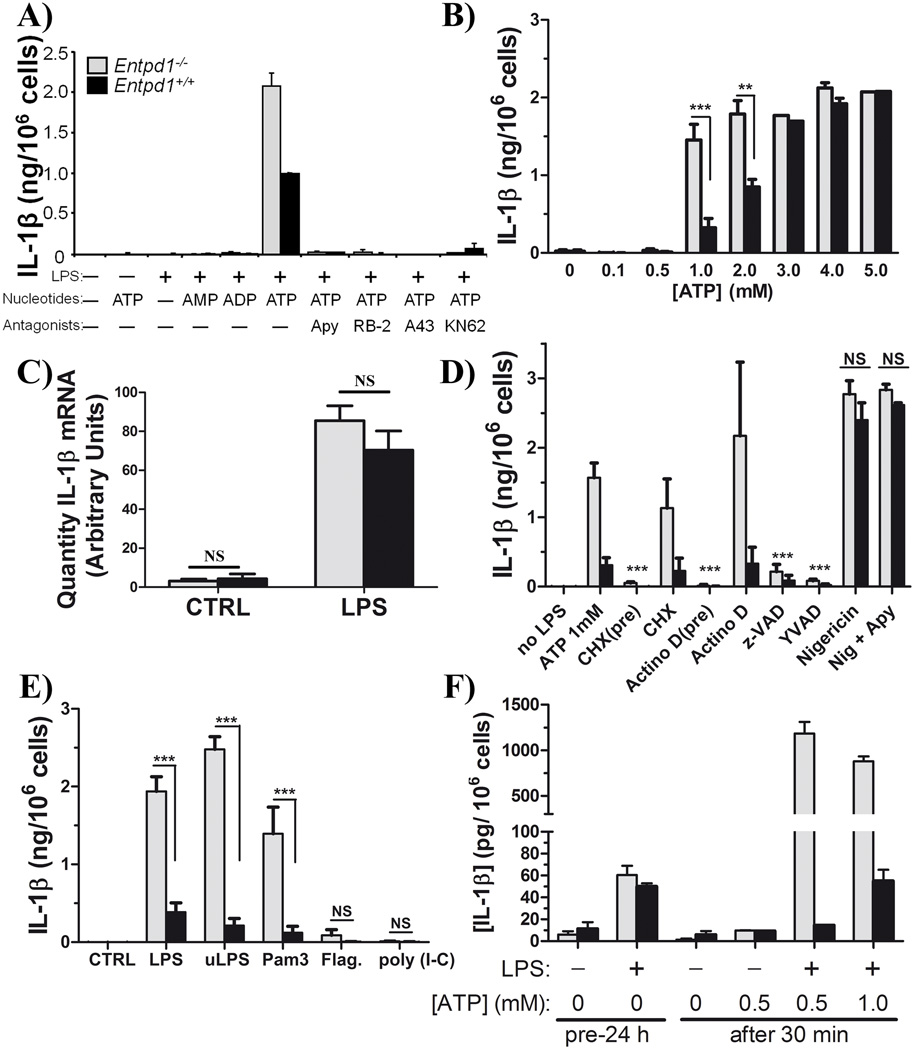
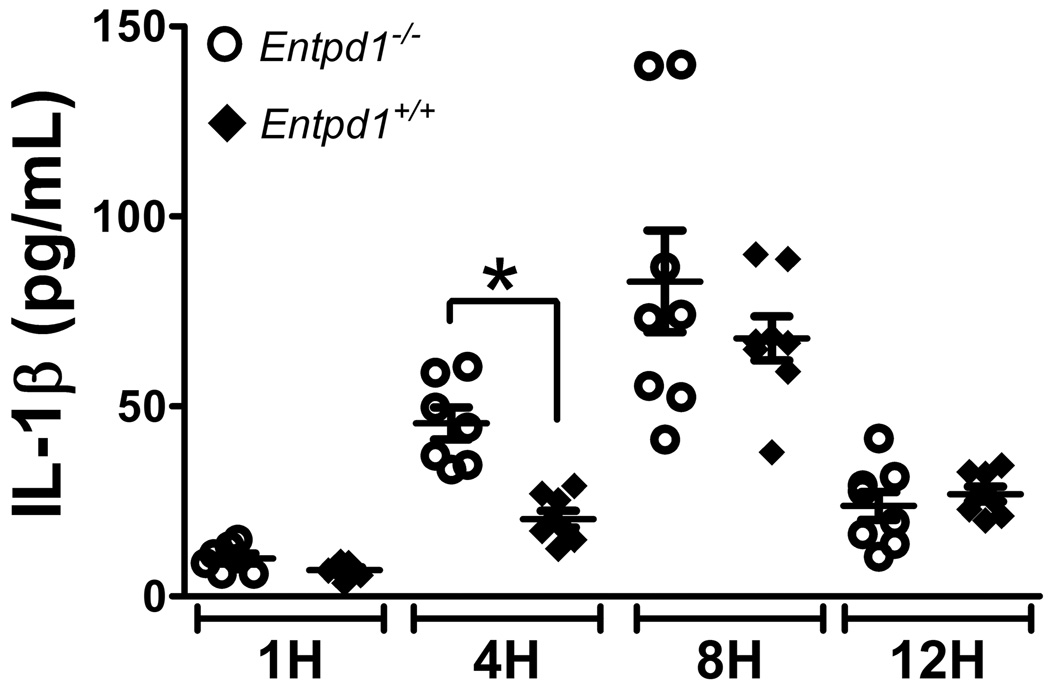
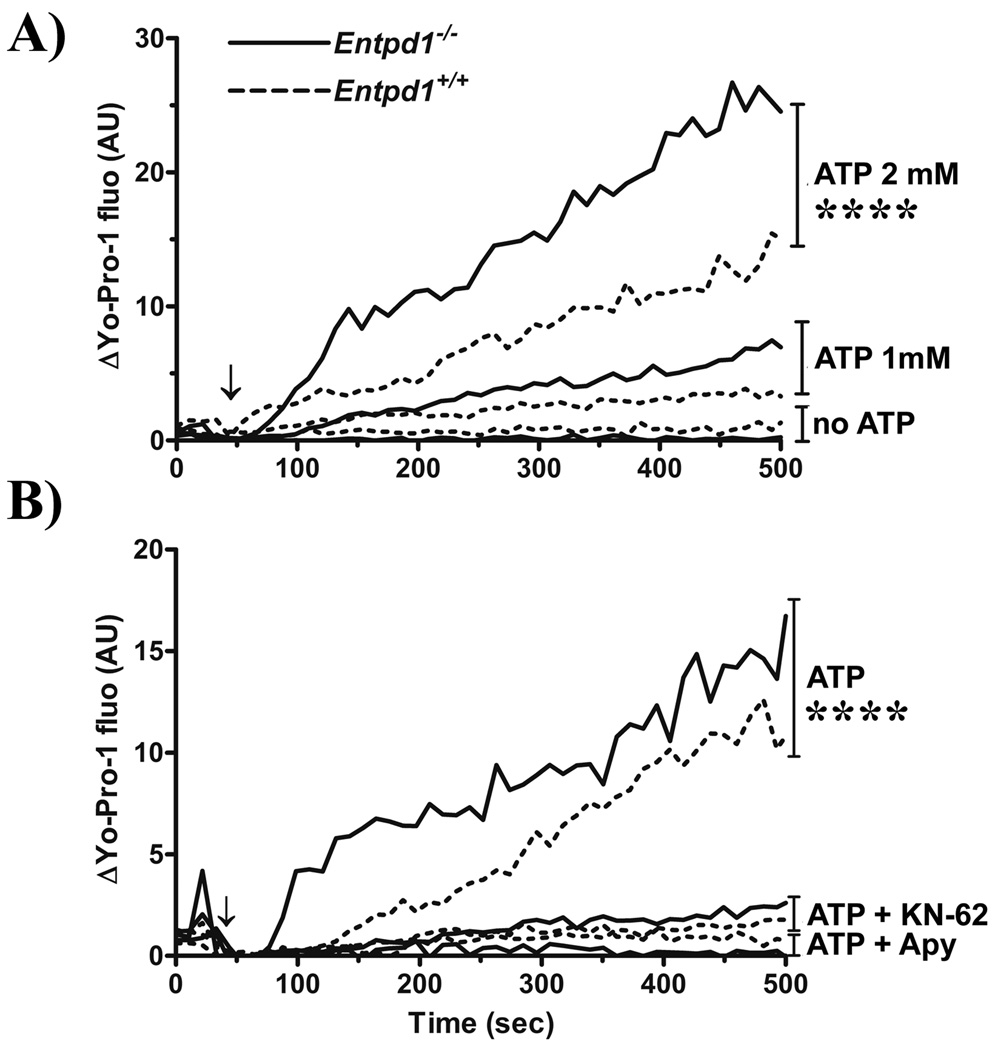
P2X7 receptor is an adenosine triphosphate (ATP)-gated ion channel within the multiprotein inflammasome complex. Until now, little is known about regulation of P2X7 effector functions in macrophages. In this study, we show that nucleoside triphosphate diphosphohydrolase 1 (NTPDase1)/CD39 is the dominant ectonucleotidase expressed by murine peritoneal macrophages and that it regulates P2X7-dependent responses in these cells. Macrophages isolated from NTPDase1-null mice (Entpd1(-/-)) were devoid of all ADPase and most ATPase activities when compared with WT macrophages (Entpd1(+/+)). Entpd1(-/-) macrophages exposed to millimolar concentrations of ATP were more susceptible to cell death, released more IL-1beta and IL-18 after TLR2 or TLR4 priming, and incorporated the fluorescent dye Yo-Pro-1 more efficiently (suggestive of increased pore formation) than Entpd1(+/+) cells. Consistent with these observations, NTPDase1 regulated P2X7-associated IL-1beta release after synthesis, and this process occurred independently of, and prior to, cytokine maturation by caspase-1. NTPDase1 also inhibited IL-1beta release in vivo in the air pouch inflammatory model. Exudates of LPS-injected Entpd1(-/-) mice had significantly higher IL-1beta levels when compared with Entpd1(+/+) mice. Altogether, our studies suggest that NTPDase1/CD39 plays a key role in the control of P2X7-dependent macrophage responses.


Conflict of interest statement

CONFLICT OF INTEREST

The authors declare no financial or commercial conflict of interest.

Figures

Fig. 1
Fig. 1. NTPDase1 is the major ectonucleotidase on mouse peritoneal macrophages elicited with thioglycollate
A) Western blot with rabbit polyclonal Ab against mouse NTPDase1 (mN1-2c). Left gel shows control proteins (0.5 µg) from lysates of COS-7 cells transfected with mouse NTPDase1 (+) or untransfected (−). Right gel shows a representative western blot (out of three performed with cells from individual mice) of proteins (12.5 µg) from peritoneal macrophage lysates. B) Flow cytometric anaylsis of NTPDase 1 analyis using non permeabilizing conditions with a polyclonal Ab against CD39 (C9F, ——), compared to its pre-immune serum (PI, ----). Data are representative of three independent experiments with pooled macrophages from 2 to 4 mice per experiment. C) NTPDase1 activity with either ATP or ADP as substrate, Entpd1+/+ (filled bars) and Entpd1−/− (grey bars) macrophages. Data show mean + SEM (n=3). ***p<0.001, two-way ANOVA with Bonferroni post hoc test. D) Time course of the hydrolysis of 2 mM ATP by Entpd1+/+ or Entpd1−/− peritoneal macrophages was followed for 12 hours by HPLC: ATP (□), ADP (■), AMP (■). No adenosine production was detected. Data show mean + SEM of three independent experiments.
Fig. 2
Fig. 2. NTPDase1 deficiency does not impact P2X7 receptor expression by peritoneal macrophages
A) P2X7 mRNA expression was quantified by qPCR. Data show mean + SEM for qPCR experiments performed in duplicate with RNA purified from macrophages obtained from 8 to 10 individual mice done separately. There were no significant differences in the expression of P2X7 mRNA between Entpd1+/+ and Entpd1−/− peritoneal macrophages (Student’s t-test). B) Flow cytometric analysis of surface P2X7 expression in Entpd1+/+ and Entpd1−/− peritoneal macrophages. Data are representative of three independent experiments with pooled macrophages from 2 to 4 mice per experiment.
Fig. 3
Fig. 3. Entpd1−/− macrophages are highly susceptible to ATP-induced death
Peritoneal macrophages were treated 12 hours with 2 mM of the indicated nucleotides in the presence or absence of potato apyrase (Apy; 2 U) or with and without P2X7 receptor antagonists (3 µM KN-62, 100 µM RB-2, 600 µM oATP). Cells positive for trypan blue incorporation were counted in a minimum of two random fields each containing over 150 cells. Data show mean + SEM of three or more experiments for each condition tested. ***p<0.001, two-way ANOVA with Bonferroni post hoc test; NS (no significant differences), p>0.05.
Fig. 4
Fig. 4. NTPDase1 modulates P2X7-dependent IL-1β release from macrophages
Macrophages (peritoneal or BMMΦ) were primed with LPS (or other TLR ligands as indicated), washed, and the medium was replaced with fresh medium containing ATP (0.1 to 5 mM) or nigericin (5 µM). Supernatants were analyzed for IL-1β concentration by ELISA. A) IL-1β released by LPS-primed peritoneal macrophages 60 min after treatment with 2 mM ATP in the presence or absence of apyrase (Apy; 2 U) or P2X7 antagonists (100 µM RB-2, 25 µM A438079 or 3 µM KN-62). Data show mean + SD of one representative experiment performed in duplicate and are representative of least three independent experiments. Data show mean + SD of one representative experiment performed out of at least three independent experiments. In the presence of 2 mM ATP IL-1β levels ranged from 1.7 to 2.3 ng/106 cells and 0.8 to 1.1 ng/106 cells for Entpd1−/− (gray bars) and Entpd1+/+ (filled bars) macrophages, respectively. B) IL-1β released by LPS-primed peritoneal macrophages 30 min after ATP treatment (0.1 to 4.0 mM). Data show mean + SEM of n ≥ 3 independent experiments. **p<0.01, ***p<0.001, two-way ANOVA with Bonferroni post hoc test. C) IL-1β mRNA in Entpd1−/− and Entpd1+/+ peritoneal macrophages primed for 3 hours with LPS (10 ng/mL) or not (CTRL) was measured by qPCR. Data show mean + SEM of RNA purified from macrophages obtained from 9 (Entpd1−/−) and 8 (Entpd1+/+) mice, respectively. NS (no significant differences), p>0.05. D) IL-1β released by LPS-primed peritoneal macrophages 30 min after 1 mM ATP or nigericin treatment was measured. The inhibitors of transcription (8 µM Actinomycin D), protein synthesis (10 µg/mL cycloheximide [CHX]), caspases (20 µM z-VAD), or caspase-1 (20 µM YVAD), were added either 15 min before LPS pre-stimulation/priming (pre) and removed before ATP stimulation, or 15 min prior to the addition of ATP when LPS was not yet removed from the media. Data show mean + SEM of n ≥ 3 experiments. After the indicated treatment, significantly less IL-1β was measured when compared to ATP 1mM (***p<0.001) for both Entpd1−/− (gray bars) and Entpd1+/+ (filled bars). There were no significant differences between Entpd1−/− and Entpd1+/+ macrophages for both nigericin (Nig) and Nig + Apy (NS, p>0.05), two-way ANOVA with Bonferroni post hoc test. E) ATP-induced IL-1β release by peritoneal macrophages primed with various TLR ligands. Cells were pre-stimulated with an agonist to either TLR4 (10 ng/mL LPS, or ultra pure LPS (uLPS); positive controls), TLR2 (100 ng/mL Pam3CSK4 [Pam3]), TLR5 (1 µg/mL flagellin, “Flag”) or TLR3 (1 µg/mL poly I:C) and then further stimulated for 30 min with 1 mM ATP. IL-1β released by these cells was quantified by ELISA. Data show mean + SEM of 3 to 8 independent experiments. **p<0.001, two-way ANOVA with Bonferroni post hoc test. F) IL-1β released by BMMΦ primed for 24 hours with LPS (+) or DMEM (−) and then stimulated 30 min with or without ATP (0, 0.5 or 1.0 mM), was measured. Data show mean + SEM of one experiment performed in triplicate.
Fig. 5
Fig. 5. NTPDase1 modulates P2X7-dependent IL-18 release from peritoneal macrophages
Macrophages were primed with LPS (10 ng/mL) for 3 hours and then treated for 30 min with either 1 or 2 mM ATP in the presence or absence of P2X7 antagonists (25 µM A438079 or 3 µM KN-62). The supernatants were analyzed for IL-18 by ELISA. Data show mean + SEM of n = 3–4 experiments. IL-18 release was normalized with nigericin as a stimulus; 100% release varied from 15 to 150 pg/106 cells depending on the experiment. *p<0.05, ***p<0.001, two-way ANOVA with Bonferroni post hoc test.
Fig. 6
Fig. 6. NTPDase1 deficiency increases IL-1β production in inflammatory air pouches
Air pouches were raised on the back of female Entpd1+/+ and Entpd1−/− C57BL/6 mice. At the indicated time in hours (H) post s.c. injection of LPS in the pouches, inflammatory exudates were collected and analyzed for IL-1β level by ELISA. Data show mean ± SEM of n = 7–8 mice per group. *p<0.05, one-way ANOVA with Bonferroni multiple comparison test.
Fig. 7
Fig. 7. NTPDase1 deficiency increases P2X7-associated Yo-Pro-1 uptake by macrophages
A) ATP dose-dependent Yo-Pro-1 uptake by peritoneal macrophages (Entpd1−/− [——], Entpd1+/+ [----]) was evaluated by measuring differences in Yo-Pro-1 mean fluorescence intensity (ΔYo-Pro-1 MFI) using flow cytometry. Cells were incubated with or without ATP (0, 1.0 and 2.0 mM) for the indicated time period. Data show ΔYo-Pro-1 expressed in arbitrary units (AU) for 275–550 cells per 11 seconds. A representative experiment out of 3 is shown. The time point corresponding to ATP addition to the cells (60 sec) is indicated on the graphs by an arrow (↓). Note that statistical analyses were carried out on complete data (n = 15–30 cells per 0.6 sec). Pairwise comparison of individual slope indicate significantly higher intensity growth for Entpd1−/− when compared to Entpd1+/+ macrophages (p≤0.002), but slope were significantly different from the baseline slope only when indicated (****, p<0.0001). B) Effect of KN-62 and apyrase (Apy) on ATP-induced Yo-Pro-1 uptake by peritoneal macrophages (Entpd1−/− [——], Entpd1+/+ [----]). The cells were stimulated with 2 mM ATP alone or in combination with KN-62 (3 µM) or Apy (2U) for the indicated period of time. Yo-Pro-1 incorporation measurement and statistical analysis were done as above. Pairwise comparison of individual slope indicate significantly higher intensity growth compared to KN-62 and Apy treatment (****p<0.0001) for both genotype.

Similar articles

Cited by

References

    1. Mosser DM, Edwards JP. Exploring the full spectrum of macrophage activation. Nat Rev Immunol. 2008;8:958–969. - PMC - PubMed
    1. Dinarello CA. The IL-1 family and inflammatory diseases. Clin Exp Rheumatol. 2002;20:S1–S13. - PubMed
    1. Pelegrin P. Targeting Interleukin-1 Signaling in Chronic Inflammation: Focus on P2X7 Receptor and Pannexin-1. Drug News Perspect. 2008;21:424–433. - PubMed
    1. Di Virgilio F. Liaisons dangereuses: P2X(7) and the inflammasome. Trends Pharmacol Sci. 2007;28:465–472. - PubMed
    1. Bours MJ, Swennen EL, Di Virgilio F, Cronstein BN, Dagnelie PC. Adenosine 5'-triphosphate and adenosine as endogenous signaling molecules in immunity and inflammation. Pharmacol Ther. 2006;112:358–404. - PubMed

Publication types

MeSH terms

LinkOut - more resources