Comparative Study
. 2010 Jun;293(6):1033-69.
doi: 10.1002/ar.21109.

Architectonic subdivisions of neocortex in the Galago (Otolemur garnetti)

Affiliations
Comparative Study

Architectonic subdivisions of neocortex in the Galago (Otolemur garnetti)

Peiyan Wong et al. Anat Rec (Hoboken). 2010 Jun.

Abstract

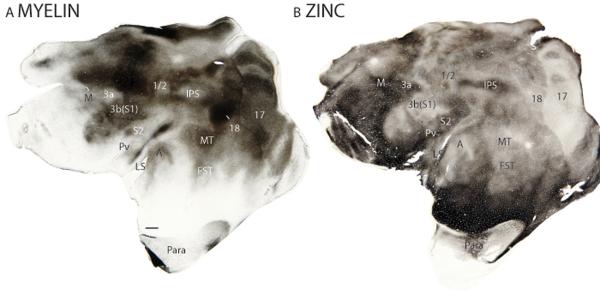
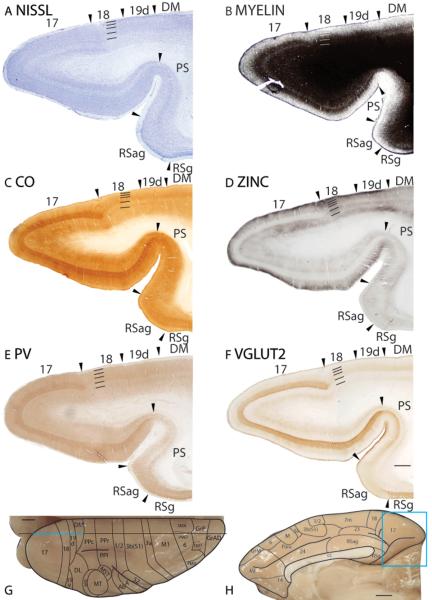
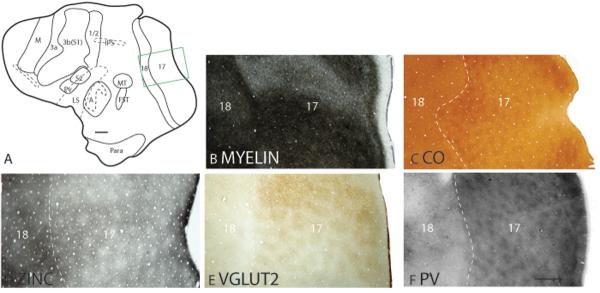
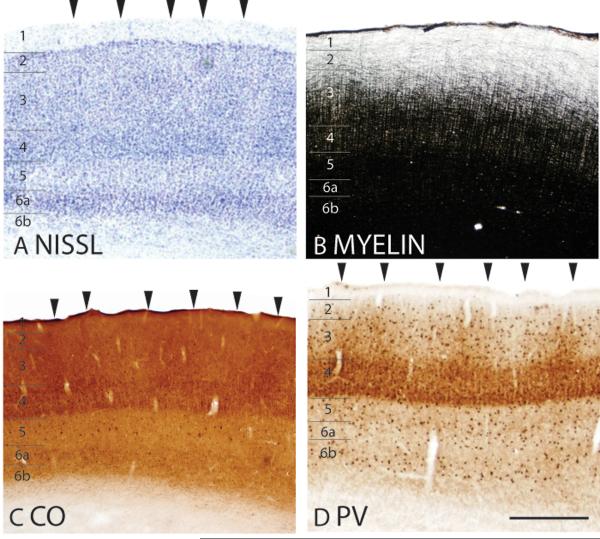
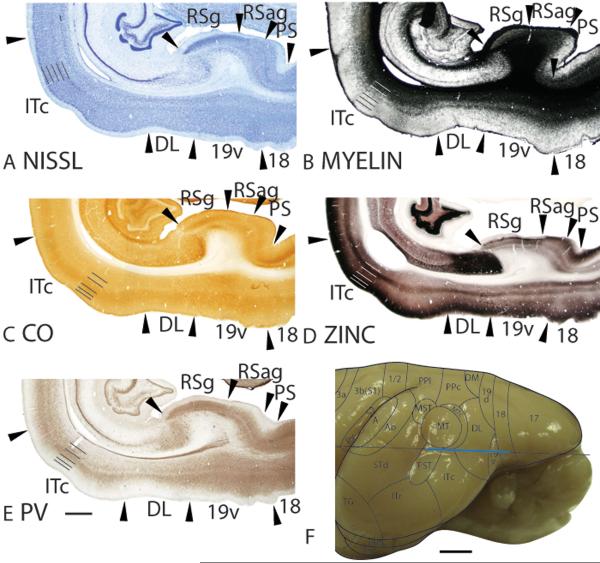
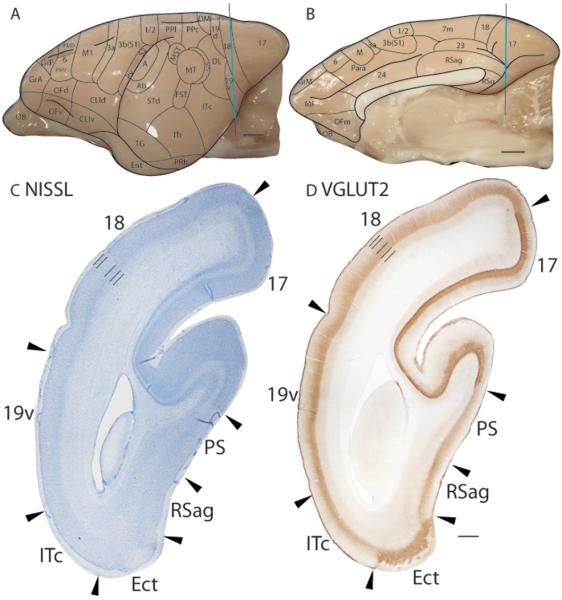
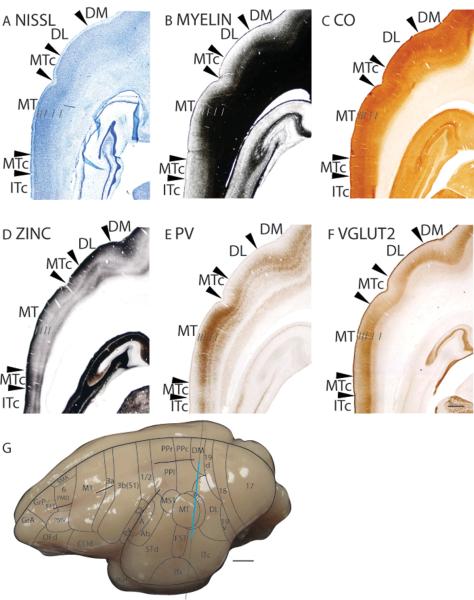
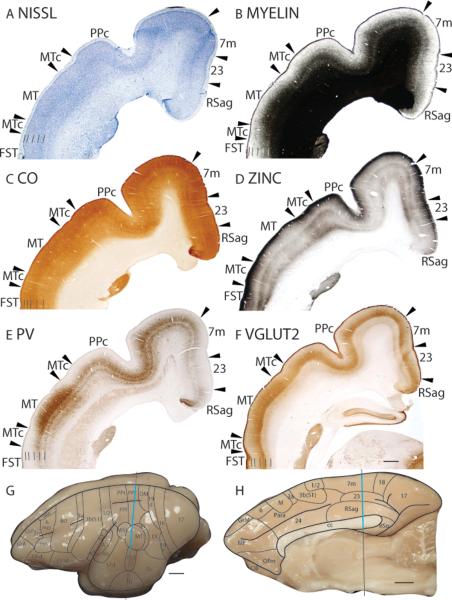
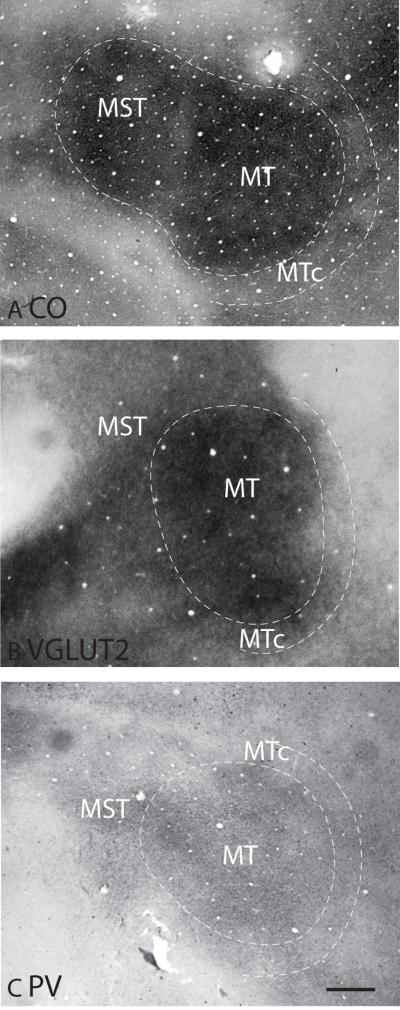
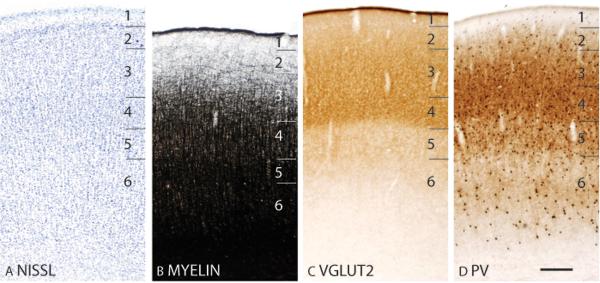
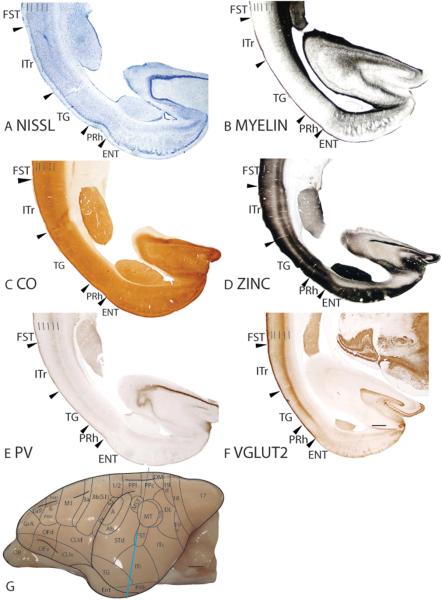
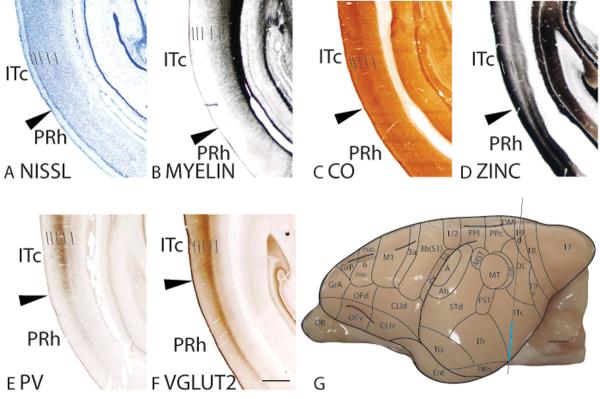
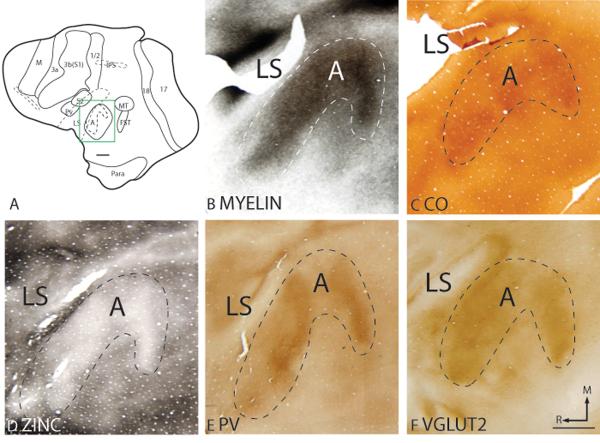
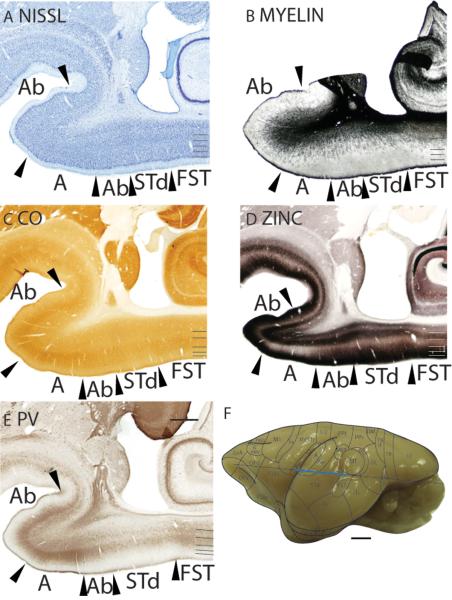
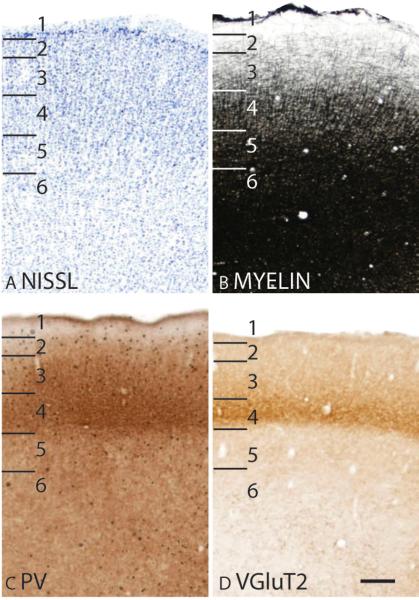
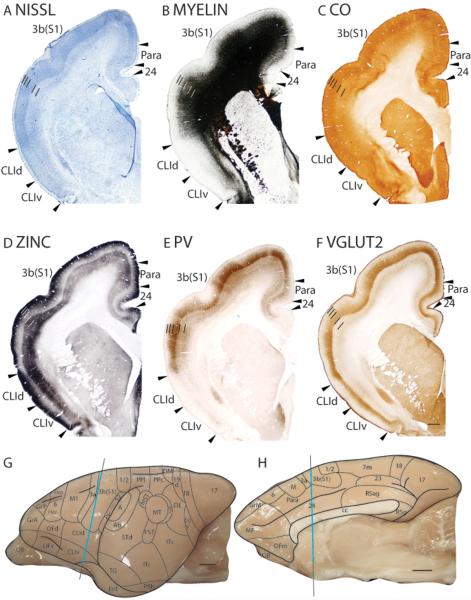
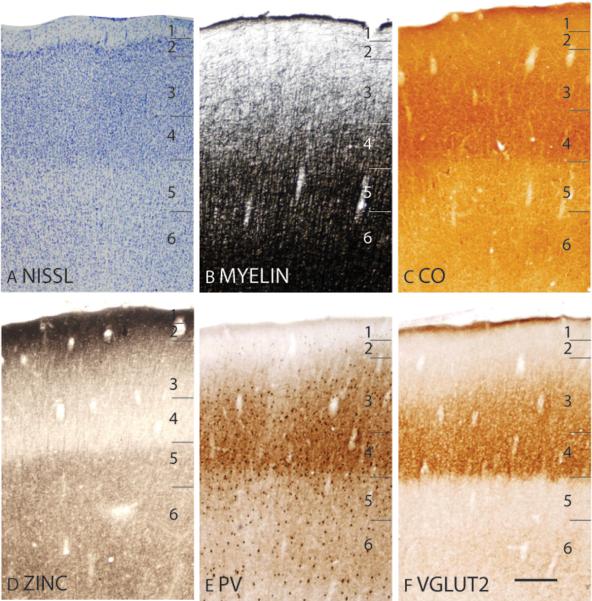
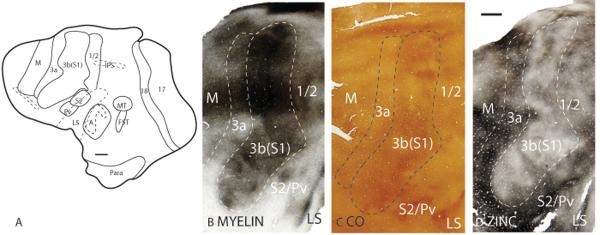
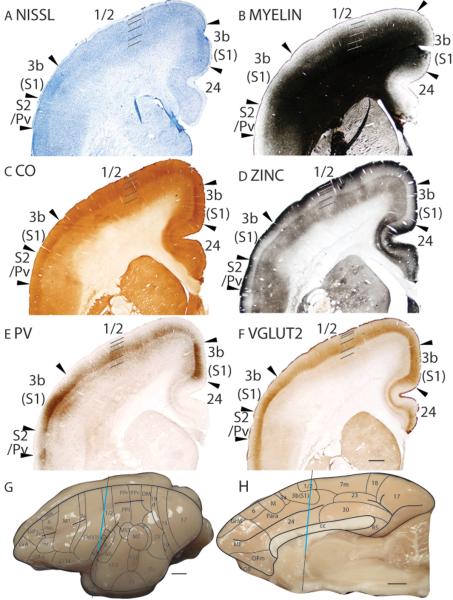
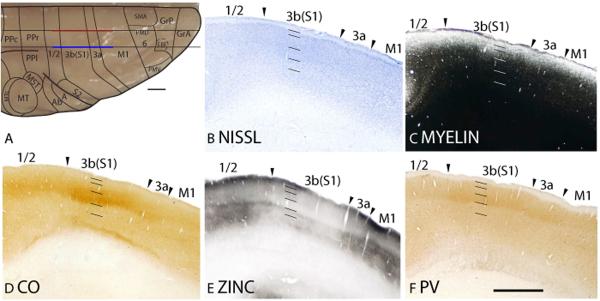
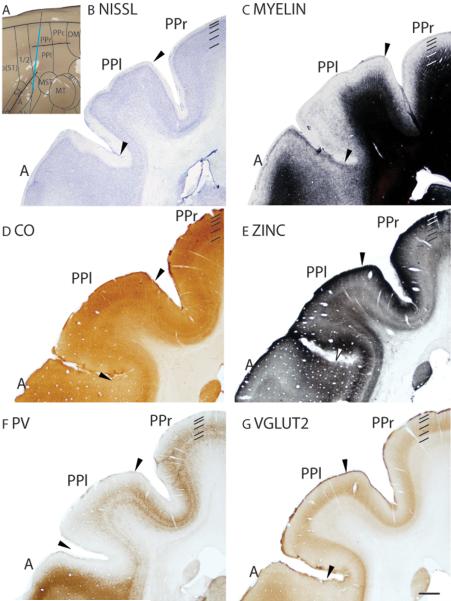
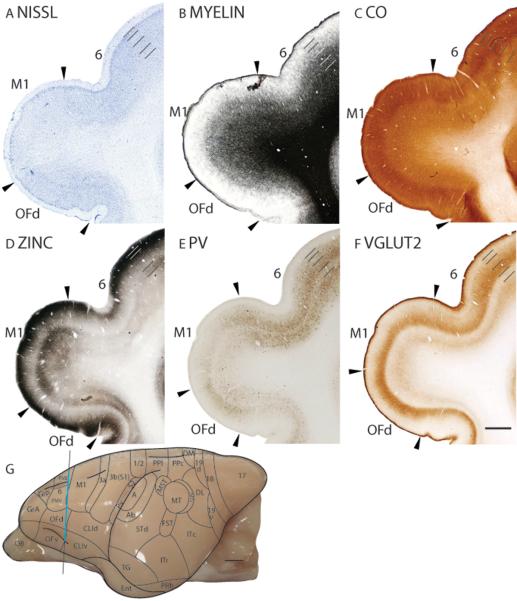
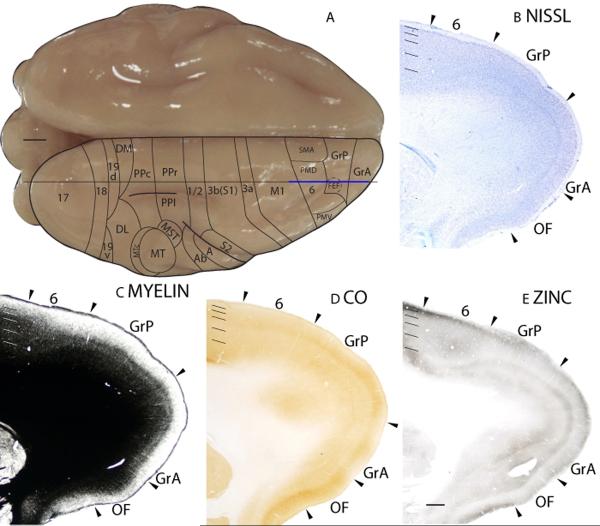
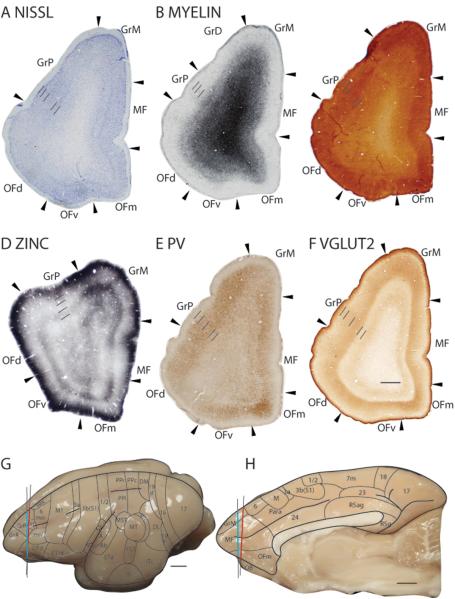
In the present study, galago brains were sectioned in the coronal, sagittal, or horizontal planes, and sections were processed with several different histochemical and immunohistochemical procedures to reveal the architectonic characteristics of the various cortical areas. The histochemical methods used included the traditional Nissl, cytochrome oxidase, and myelin stains, as well as a zinc stain, which reveals free ionic zinc in the axon terminals of neurons. Immunohistochemical methods include parvalbumin (PV) and calbindin (CB), both calcium-binding proteins, and the vesicle glutamate transporter 2 (VGluT2). These different procedures revealed similar boundaries between areas, which suggests that functionally relevant borders were being detected. These results allowed a more precise demarcation of previously identified areas. As thalamocortical terminations lack free ionic zinc, primary cortical areas were most clearly revealed by the zinc stain, because of the poor zinc staining of layer 4. Area 17 was especially prominent, as the broad layer 4 was nearly free of zinc stain. However, this feature was less pronounced in the primary auditory and somatosensory cortex. As VGluT2 is expressed in thalamocortical terminations, layer 4 of primary sensory areas was darkly stained for VGluT2. Primary motor cortex had reduced VGluT2 staining, and increased zinc-enriched terminations in the poorly developed granular layer 4 compared to the adjacent primary somatosensory area. The middle temporal visual (MT) showed increased PV and VGluT2 staining compared to the surrounding cortical areas. The resulting architectonic maps of cortical areas in galagos can usefully guide future studies of cortical organizations and functions.


Figures

Figure 1
Figure 1
Architectonic characteristics galago cortex in flattened preparations stained for myelin (A) and for synaptic zinc (B). Scale bar in panel A = 2mm.
Figure 2
Figure 2
Architectonic characteristics of visual areas 17, 18, 19d and DM. Sagittal sections from occipital cortex were processed for (A) Nissl substance, (B) myelin, (C) CO, (D) synaptic zinc, (F) parvalbumin (PV) and (F) vesicle glutamate transporter 2 (VGluT2). The architectonic borders of proposed cortical areas are shown on the dorsal view (G) and medial view (H) of the galago brain. The horizontal line on the brain shows the level from which the sections were taken for panels A–F. The thicker portion of the line marks the regions illustrated in panels A–F. Occipital areas 17, 18 and 19 are adopted from Brodmann (1909). DM is the dorsal medial visual area. Arrowheads on the sections illustrated here and in the following figures mark architectonic boundaries. Short lines on the sections indicate cortical layers 1 to 6. See table 1 for abbreviations for other areas. The scale bar for brain sections (panel E) = 1mm. The scale bar on the brain (panel F) = 2.5mm.
Figure 3
Figure 3
Patchy staining pattern of area 17. The boxed region in A is shown in panels B to F at higher magnification. A myelin (B), CO (C), synaptic zinc (D) VGluT2 (E) and PV (F) stained section cut parallel to the surface of an artificially flattened cerebral hemisphere. Cytochrome oxidase rich regions, known as CO blobs are observed in area 17 of the galago neocortex (C). Dashed lines show the approximate location of the cortical borders. Scale bar in panel A = 4mm, in panel F = 1mm.
Figure 4
Figure 4
The laminar characteristics of area 17 at higher magnification. The arrowheads in panels A, C and D indicate the locations of CO blobs in layer 3. Layer 6 has two sublayers, 6a and 6b, that are apparent in Nissl, and PV preparations. Scale bar = 0.5mm.
Figure 5
Figure 5
Architectonic characteristics of visual and temporal visual areas. The level at which the horizontal sections are taken from is indicated by the horizontal line on the lateral view of the brain in panel F. The thicker line in panel F marks the regions illustrated in panels A–E. The extent of each cortical layers 1 to 6 is indicated by the short horizontal lines on panels A–E. The scale bar for brain sections (panel E) = 1mm. The scale bar on the brain (panel F) = 2.5mm.
Figure 6
Figure 6
Architectonic characteristics of visual areas and adjoining retrosplenial cortex. Coronal sections from occipital cortex were processed for (C) Nissl substance and (D) VGluT2. The level at which the coronal sections are taken from is indicated by the vertical line on the lateral and medial view of the brain in panels A and B respectively. The thicker line in panel A and B marks the regions illustrated in panels C and D. Short lines on the sections indicate the extent of each cortical layers 1 to 6. See table 1 for abbreviations for other areas. The scale bar for brain (panels A and B) = 2.5mm. The scale bar on the brain section (panel D) = 1mm.
Figure 7
Figure 7
Architectonic characteristics of middle temporal cortex. The level at which the coronal sections are taken from is indicated by the vertical line on the dorsolateral view of the brain in panels G. The thicker line in panel G marks the regions illustrated in panels A to F. Short lines on the sections indicate the extent of each cortical layers 1 to 6. See table 1 for abbreviations for other areas. The scale bar for brain (panel G) = 1mm. The scale bar on the brain section (panel F) = 2.5mm.
Figure 8
Figure 8
Architectonic characteristics of middle temporal cortex. The level at which the coronal sections are taken from is indicated by the vertical line on the dorsolateral (G) and medial (H) views of the brain. The thicker line in panels G and H marks the regions illustrated in panels A to F. Short lines on the sections indicate the extent of each cortical layers 1 to 6. See table 1 for abbreviations for other areas. The scale bar for brain (panels G and H) = 2.5mm. The scale bar on the brain section (panel F) = 1mm.
Figure 9
Figure 9
Architectonic characteristics of middle temporal cortex in flattened preparations stained for CO (A), VGluT2 (B) and PV (C). Dashed lines show the approximate location of the cortical borders. The scale bar on the brain section (panel C) = 1mm.
Figure 10
Figure 10
The laminar characteristics of MT at higher magnification. Scale bar = 0.25mm.
Figure 11
Figure 11
Architectonic characteristics of inferior temporal cortex. The level at which the coronal sections are taken from is indicated by the vertical line on the lateral view of the brain in panels G. The thicker line in panel G marks the regions illustrated in panels A to F. Short lines on the sections indicate the extent of each cortical layers 1 to 6. See table 1 for abbreviations for other areas. The scale bar for brain (panel G) = 2.5mm. The scale bar on the brain section (panel F) = 1mm.
Figure 12
Figure 12
Architectonic characteristics of inferior temporal cortex. The level at which the coronal sections are taken from is indicated by the vertical line on the dorsolateral view of the brain in panels G. The thicker line in panel G marks the regions illustrated in panels A to F. Short lines on the sections indicate the extent of each cortical layers 1 to 6. See table 1 for abbreviations for other areas. The scale bar for brain (panel G) = 2.5mm. The scale bar on the brain section (panel F) = 1mm.
Figure 13
Figure 13
Architectonic characteristics of auditory cortex in flattened preparations. The boxed region in A is shown in panels B to F at higher magnification. Dashed lines show the approximate location of the cortical borders. The scale bar on the brain (panel A) = 4mm, on brain section (panel F) = 2mm.
Figure 14
Figure 14
Architectonic characteristics of auditory cortex. The level at which the horizontal sections are taken from is indicated by the horizontal line on the lateral view of the brain in F. The thicker line in panel F marks the regions illustrated in panels A to E. Short lines on the sections indicate the extent of each cortical layers 1 to 6. See table 1 for abbreviations for other areas. The scale bar for brain (panel F) = 2.5mm. The scale bar on the brain section (panel E) = 1mm.
Figure 15
Figure 15
The laminar characteristics of primary auditory area at higher magnification. Scale bar = 0.25 mm.
Figure 16
Figure 16
Architectonic characteristics of somatosensory cortex. The level at which the coronal sections are taken from is indicated by the vertical line on the lateral (G) and medial (H) of the brain. The thicker line in panels G and H marks the regions illustrated in panels A to F. Short lines on the sections indicate the extent of each cortical layers 1 to 6. See table 1 for abbreviations for other areas. The scale bar for brain (panels G, H) = 2.5mm. The scale bar on the brain section (panel F) = 1mm.
Figure 17
Figure 17
The laminar characteristics of primary somatosensory area at higher magnification. Scale bar = 0.25mm.
Figure 18
Figure 18
Architectonic characteristics of somatosensory cortex in flattened preparations. The boxed region in A is shown in panels B to D at higher magnification. Dashed lines show the approximate location of the cortical borders. The scale bar on the brain (panel A) = 4mm, on brain section (panel D) = 2mm.
Figure 19
Figure 19
Architectonic characteristics of somatosensory cortex. The level at which the coronal sections are taken from is indicated by the vertical line on the lateral (G) and medial (H) of the brain. The thicker line in panels G and H marks the regions illustrated in panels A to F. Short lines on the sections indicate the extent of each cortical layers 1 to 6. See table 1 for abbreviations for other areas. The scale bar for brain (panels G, H) = 2.5mm. The scale bar on the brain section (panel F) = 1mm.
Figure 20
Figure 20
Architectonic characteristics of somatosensory cortex. The level at which the sagittal sections are taken from is indicated by the horizontal lines on the dorsal view (A) of the brain. The thicker lines in panel A marks the regions illustrated in panels B to F, with the red line indicating the regions illustrated in panel C and the blue line indicating the regions illustrated in panels B, C, D and F. Short lines on the sections indicate the extent of each cortical layers 1 to 6. See table 1 for abbreviations for other areas. The scale bar for brain (panel A) = 2.5mm. The scale bar on the brain section (panel F) = 1mm.
Figure 21
Figure 21
Architectonic characteristics of posterior parietal cortex. The level at which the coronal sections are taken from is indicated by the vertical line on the dorsolateral view of the brain (A). The thicker line in panel A marks the regions illustrated in panels B to G. Short lines on the sections indicate the extent of each cortical layers 1 to 6. See table 1 for abbreviations for other areas. The scale bar for brain (panel A) = 2.5mm. The scale bar on the brain section (panel G) = 1mm.
Figure 22
Figure 22
Architectonic characteristics of frontal cortex. The level at which the coronal sections are taken from is indicated by the vertical line on the lateral view of the brain (G). The thicker line in panel G marks the regions illustrated in panels A to F. Short lines on the sections indicate the extent of each cortical layers 1 to 6. See table 1 for abbreviations for other areas. The scale bar for brain (panel G) = 2.5mm. The scale bar on the brain section (panel F) = 1mm.
Figure 23
Figure 23
Architectonic characteristics of frontal cortex. The level at which the coronal sections are taken from is indicated by the horizontal line on the dorsal view of the brain (A). The thicker line in panel A marks the regions illustrated in panels B to E. Short lines on the sections indicate the extent of each cortical layers 1 to 6. See table 1 for abbreviations for other areas. The scale bar for brain (panel A) = 2.5mm. The scale bar on the brain section (panel E) = 1mm.
Figure 24
Figure 24
Architectonic characteristics of frontal cortex. The level at which the coronal sections are taken from is indicated by the vertical lines on the lateral (G) and medial (H) views of the brain. The thicker lines in panels G and H marks the regions illustrated in panels A to F with the red line indicating the regions illustrated in panel D and the blue line indicating the regions illustrated in panel A, B, C, E and F. Short lines on the sections indicate the extent of each cortical layers 1 to 6. See table 1 for abbreviations for other areas. The scale bar for brain (panel G, H) = 2.5mm. The scale bar on the brain section (panel F) = 1mm.

Similar articles

Cited by

References

    1. Allman JM, Kaas JH. Representation of the visual field in striate and adjoining cortex of the owl monkey (Aotus trivirgatus) Brain Res. 1971a;35(1):89–106. - PubMed
    1. Allman JM, Kaas JH. A representation of the visual field in the caudal third of the middle tempral gyrus of the owl monkey (Aotus trivirgatus) Brain Res. 1971b;31(1):85–105. - PubMed
    1. Allman JM, Kaas JH. The organization of the second visual area (V II) in the owl monkey: a second order transformation of the visual hemifield. Brain Res. 1974;76(2):247–265. - PubMed
    1. Allman JM, Kaas JH. The dorsomedial cortical visual area: a third tier area in the occipital lobe of the owl monkey (Aotus trivirgatus) Brain Res. 1975;100(3):473–487. - PubMed
    1. Allman JM, Campbell CB, McGuinness E. The dorsal third tier area in Galago senegalensis. Brain Res. 1979;179(2):355–361. - PubMed

Publication types

MeSH terms