Nitric oxide, oxygen, and superoxide formation and consumption in macrophages and colonic epithelial cells
- PMID: 20201482
- PMCID: PMC2879621
- DOI: 10.1021/tx900415k
Nitric oxide, oxygen, and superoxide formation and consumption in macrophages and colonic epithelial cells
Abstract
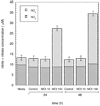
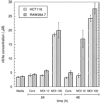
Knowledge of the rates at which macrophages and epithelial cells synthesize NO is critical for predicting the concentrations of NO and other reactive nitrogen species in colonic crypts during inflammation, and elucidating the linkage between inflammatory bowel disease, NO, and cancer. Macrophage-like RAW264.7 cells, primary bone marrow-derived macrophages (BMDM), and HCT116 colonic epithelial cells were subjected to simulated inflammatory conditions, and rates of formation and consumption were determined for NO, O(2), and O(2)(-). Production rates of NO were determined in either of two ways: continuous monitoring of NO concentrations in a closed chamber with corrections for autoxidation, or NO(2)(-) accumulation measurements in an open system with corrections for diffusional losses of NO. The results obtained using the two methods were in excellent agreement. Rates of NO synthesis (2.3 +/- 0.6 pmol s(-1) 10(6) cells(-1)), NO consumption (1.3 +/- 0.3 s(-1)), and O(2) consumption (59 +/- 17 pmol s(-1) 10(6) cells(-1) when NO is negligible) for activated BMDM were indistinguishable from those of activated RAW264.7 cells. NO production rates calculated from NO(2)(-) accumulation data for HCT116 cells infected with Helicobacter cinaedi (3.9 +/- 0.1 pmol s(-1) 10(6) cells(-1)) were somewhat greater than those of RAW264.7 macrophages infected under similar conditions (2.6 +/- 0.1 pmol s(-1) 10(6) cells(-1)). Thus, RAW264.7 cells have NO kinetics nearly identical to those of primary macrophages, and stimulated epithelial cells are capable of synthesizing NO at rates comparable to those of macrophages. Using these cellular kinetic parameters, simulations of NO diffusion and reaction in a colonic crypt during inflammation predict maximum NO concentrations of about 0.2 microM at the base of a crypt.
Figures


Similar articles
-
Prediction of nitric oxide concentrations in colonic crypts during inflammation.Nitric Oxide. 2008 Nov;19(3):266-75. doi: 10.1016/j.niox.2008.04.025. Epub 2008 May 3. Nitric Oxide. 2008. PMID: 18501201
-
Nitric oxide, oxygen, and superoxide formation and consumption in macrophage cultures.Chem Res Toxicol. 2005 Mar;18(3):486-93. doi: 10.1021/tx049879c. Chem Res Toxicol. 2005. PMID: 15777088
-
Effect of liquid depth on the synthesis and oxidation of nitric oxide in macrophage cultures.Chem Res Toxicol. 2002 Apr;15(4):490-6. doi: 10.1021/tx010126p. Chem Res Toxicol. 2002. PMID: 11952334
-
The complex interplay of iron metabolism, reactive oxygen species, and reactive nitrogen species: insights into the potential of various iron therapies to induce oxidative and nitrosative stress.Free Radic Biol Med. 2013 Dec;65:1174-1194. doi: 10.1016/j.freeradbiomed.2013.09.001. Epub 2013 Sep 12. Free Radic Biol Med. 2013. PMID: 24036104 Review.
-
Management of the virulent influenza virus infection by oral formulation of nonhydrolized carnosine and isopeptide of carnosine attenuating proinflammatory cytokine-induced nitric oxide production.Am J Ther. 2012 Jan;19(1):e25-47. doi: 10.1097/MJT.0b013e3181dcf589. Am J Ther. 2012. PMID: 20841992 Review.
Cited by
-
Quantitation of spin probe-detectable oxidants in cells using electron paramagnetic resonance spectroscopy: To probe or to trap?Free Radic Biol Med. 2020 Jul;154:84-94. doi: 10.1016/j.freeradbiomed.2020.04.020. Epub 2020 May 4. Free Radic Biol Med. 2020. PMID: 32376456 Free PMC article.
-
Nitric oxide produced endogenously is responsible for hypoxia-induced HIF-1α stabilization in colon carcinoma cells.Chem Res Toxicol. 2012 Oct 15;25(10):2194-202. doi: 10.1021/tx300274a. Epub 2012 Sep 25. Chem Res Toxicol. 2012. PMID: 22971010 Free PMC article.
-
CellNO trap: Novel device for quantitative, real-time, direct measurement of nitric oxide from cultured RAW 267.4 macrophages.Redox Biol. 2016 Aug;8:383-97. doi: 10.1016/j.redox.2016.03.006. Epub 2016 Mar 31. Redox Biol. 2016. PMID: 27058115 Free PMC article.
-
On the Anti-Cancer Effect of Cold Atmospheric Plasma and the Possible Role of Catalase-Dependent Apoptotic Pathways.Cells. 2020 Oct 21;9(10):2330. doi: 10.3390/cells9102330. Cells. 2020. PMID: 33096638 Free PMC article.
-
The pathogenic biomarker alcohol dehydrogenase protein is involved in Bacillus cereus virulence and survival against host innate defence.PLoS One. 2022 Jan 4;17(1):e0259386. doi: 10.1371/journal.pone.0259386. eCollection 2022. PLoS One. 2022. PMID: 34982789 Free PMC article.
References
-
- Tamir S, Tannenbaum SR. The role of nitric oxide in the carcinogenic process. Biochim Biophys Acta. 1996;1288:31–36. - PubMed
-
- Levin B. Ulcerative colitis and colon cancer: biology and surveillance. J Cell Biochem Suppl. 1993;16G:47–50. - PubMed
-
- Farrell RJ, Peppercorn MA. Ulcerative colitis. Lancet. 2002;359:331–340. - PubMed
-
- Singer I, Kawka DW, Scott S, Weidner JR, Mumford RA, Riehl TE, Stenson WF. Expression of inducible nitric oxide synthase and nitrotyrosine in colonic epithelium in inflammatory bowel disease. Gastroenterology. 1996;111:871–885. - PubMed
-
- Kimura H, Hokari R, Miura S, Shigetmatsu T, Hirokawa M, Akiba Y, Kurose I, Higuchi H, Fujimori H, Tsuzuki Y, Serizawa H, Ishii H. Increased expression of an inducible isoform of nitric oxide synthase and the formation of peroxynitrite in colonic mucosa of patients with active ulcerative colitis. Gut. 1998;42:180–187. - PMC - PubMed
Publication types
MeSH terms
Substances
Grants and funding
LinkOut - more resources
Full Text Sources
Other Literature Sources

