. 2010 Mar 30;49(12):2615-26.
doi: 10.1021/bi901516d.

Structure of the 1,N(2)-etheno-2'-deoxyguanosine lesion in the 3'-G(epsilon dG)T-5' sequence opposite a one-base deletion

Affiliations

Structure of the 1,N(2)-etheno-2'-deoxyguanosine lesion in the 3'-G(epsilon dG)T-5' sequence opposite a one-base deletion

Ganesh Shanmugam et al. Biochemistry. .

Abstract

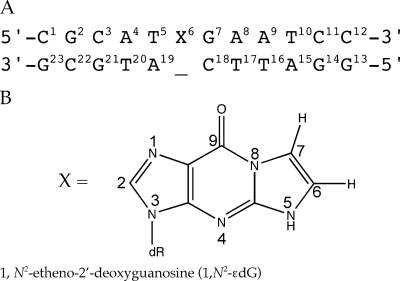
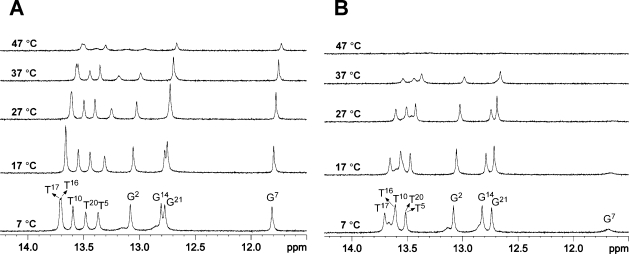
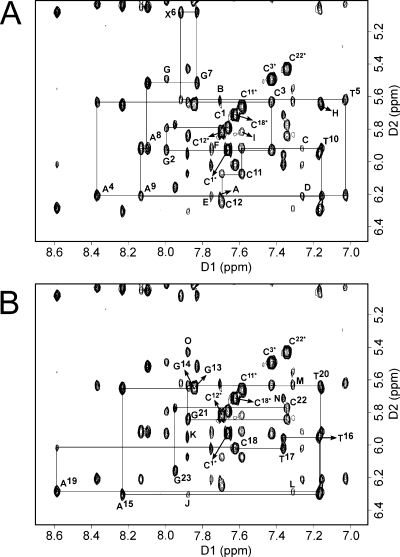
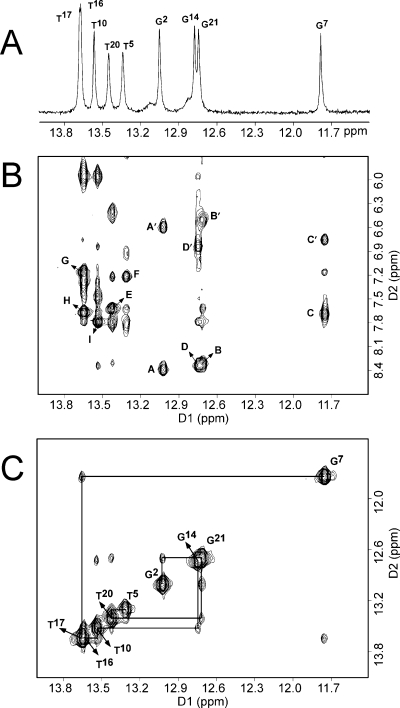
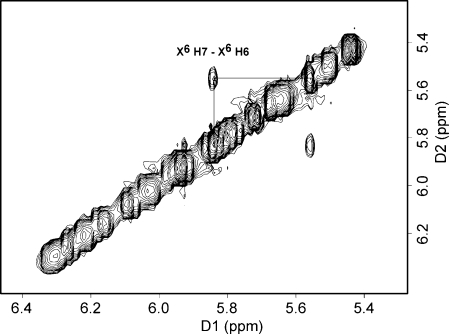
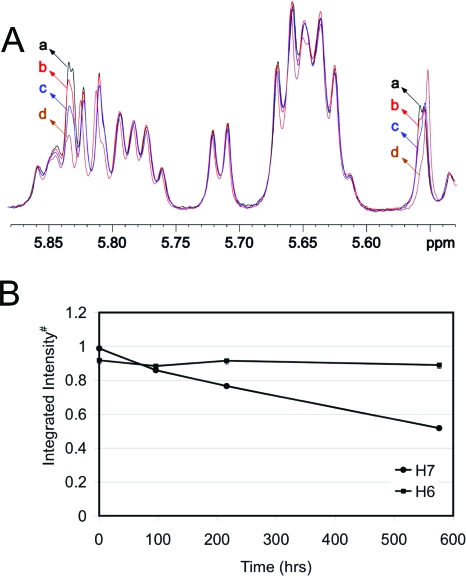
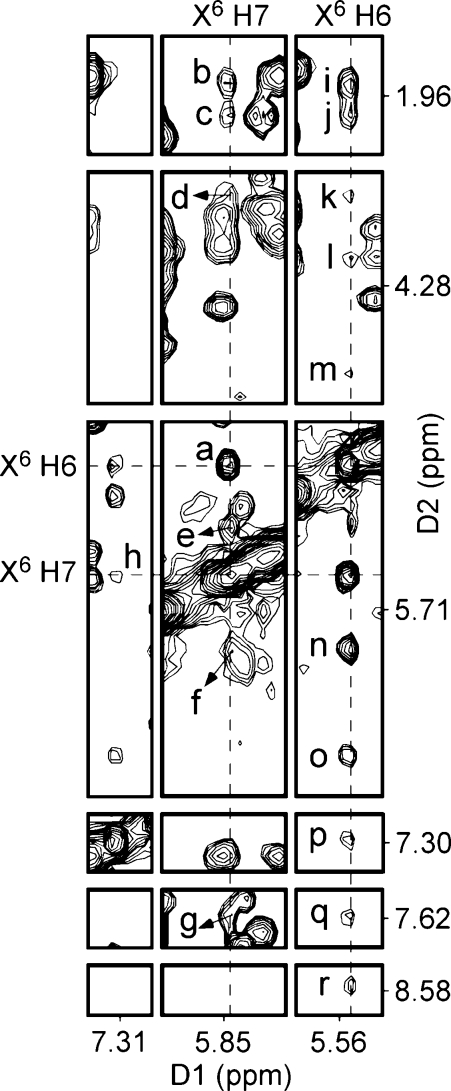
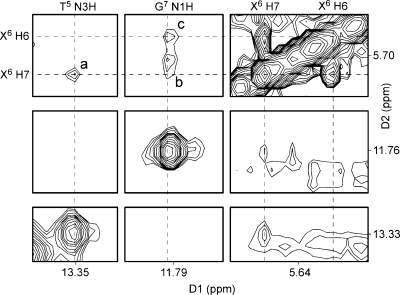
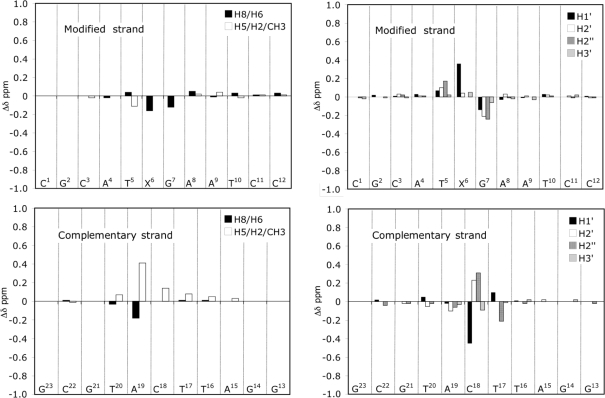
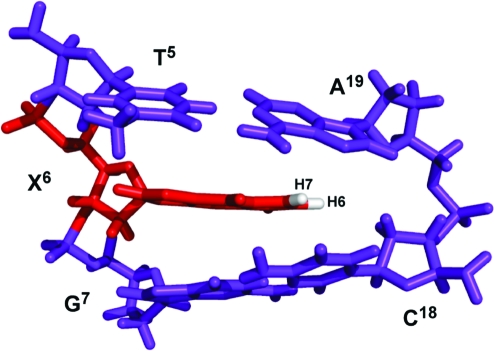
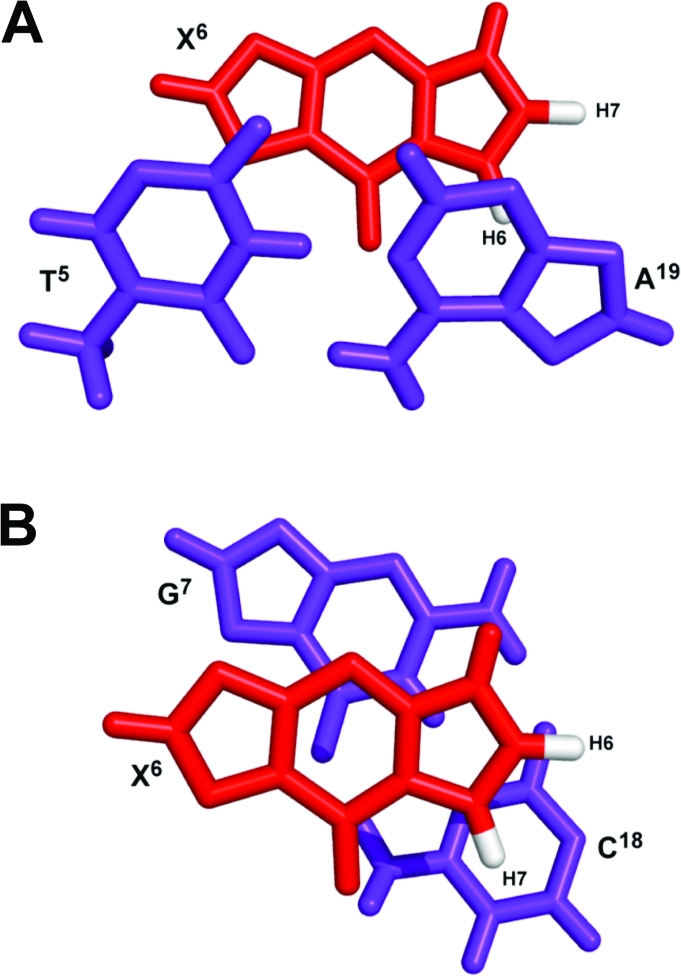
The structure of the 1,N(2)-ethenodeoxyguanosine lesion (1,N(2)-epsilondG) has been characterized in 5'-d(CGCATXGAATCC)-3'.5'-d(GGATTCATGCG)-3' (X = 1,N(2)-epsilondG), in which there is no dC opposite the lesion. This duplex (named the 1-BD duplex) models the product of translesion bypass of 1,N(2)-epsilondG by Sulfolobus solfataricus P2 DNA polymerase IV (Dpo4) [Zang, H., Goodenough, A. K., Choi, J. Y., Irimia, A., Loukachevitch, L. V., Kozekov, I. D., Angel, K. C., Rizzo, C. J., Egli, M., and Guengerich, F. P. (2005) J. Biol. Chem. 280, 29750-29764], leading to a one-base deletion. The T(m) of this duplex is 6 degrees C higher than that of the duplex in which dC is present opposite the 1,N(2)-epsilondG lesion and 8 degrees C higher than that of the unmodified 1-BD duplex. Analysis of NOEs between the 1,N(2)-epsilondG imidazole and deoxyribose H1' protons and between the 1,N(2)-epsilondG etheno H6 and H7 protons and DNA protons establishes that 1,N(2)-epsilondG adopts the anti conformation about the glycosyl bond and that the etheno moiety is accommodated within the helix. The resonances of the 1,N(2)-epsilondG H6 and H7 etheno protons shift upfield relative to the monomer 1,N(2)-epsilondG, attributed to ring current shielding, consistent with their intrahelical location. NMR data reveal that Watson-Crick base pairing is maintained at both the 5' and 3' neighbor base pairs. The structure of the 1-BD duplex has been refined using molecular dynamics calculations restrained by NMR-derived distance and dihedral angle restraints. The increased stability of the 1,N(2)-epsilondG lesion in the absence of the complementary dC correlates with the one-base deletion extension product observed during the bypass of the 1,N(2)-epsilondG lesion by the Dpo4 polymerase, suggesting that stabilization of this bulged intermediate may be significant with regard to the biological processing of the lesion.


Figures

Scheme 1
Scheme 1. (A) 1-BD-Modified Oligodeoxynucleotide Numbering Scheme and (B) Structure and Numbering Scheme for the 1,N2-εdG Adduct
The imidazole proton of the 1,N2-εdG nucleotide is designated as H2, corresponding to the H8 proton in guanine.
Figure 1
Figure 1
Temperature-dependent 1H NMR spectra (imino proton region) for the 1-BD (A) and unmodified 1-BD (B) duplex.
Figure 2
Figure 2
Expanded plot of a phase sensitive NOESY spectrum (250 ms) in D2O buffer for the 1-BD oligodeoxynucleotide duplex showing the sequential NOEs from the aromatic to H1′ protons. The spectrum was recorded at 25 °C. (A) Connectivities are traced for the 1,N2-εdG-modified strand: Additional cross-peaks, (A) A4 H2 → A4 H1′, (B) A4 H2 → T5 H1′, (C) A8 H2 → A8 H1′, (D) A8 H2 → A9 H1′, (E) A9 H2 → A9 H1′, (F) A9 H2 → T10 H1′, (G) G2 H8 → C3 H5, (H) T10 H6 → C11 H5, and (I) C11 H6 → C12 H5. (B) Connectivities are traced for the complementary strand: Additional cross-peaks, (J) A15 H2 → A15 H1′, (K) A15 H2 → T16 H1′, (L) A19 H2 → A19 H1′, (M) A19 H2 → T20 H1′, (N) T17 H6 → C18 H5, and (O) G21 H8 → C22 H5.
Figure 3
Figure 3
(A) Downfield region of the 1H NMR spectrum for the 1-BD duplex showing the imino proton resonances. (B) Expanded plot of a NOESY spectrum with a mixing time of 250 ms for the 1-BD duplex showing the sequential NOEs between the imino protons and the amino and base protons: (A and A′) G2 N1H → C22 N4H, h/n; (B and B′) G21 N1H → C3 N4H, h/n; (C and C′) G7 N1H → C18 N4H, h/n; (D and D′) G14 N1H → C11 N4H, h/n; (E) T20 N3H → A4 H2; (F) T5 N3H → A19 H2; (G) T17 N3H → A8 H2; (H) T16 N3H → A9 H2; and (I) T10 N3H → A15 H2. The symbols h and n denote hydrogen-bonded and non-hydrogen-bonded amino protons of cytosine, respectively. (C). Expanded plot of a NOESY spectrum showing sequential NOE connectivity for the imino protons of the G2·C23 → G14·C11 base pairs for the 1-BD duplex. The labels designate the imino proton of the indicated nucleotide. The spectra were recorded at 7 °C.
Figure 4
Figure 4
Expanded region of the 1H COSY spectrum showing a cross-peak between etheno H7 and H6 protons. The spectrum was recorded at 25 °C.
Figure 5
Figure 5
(A) Time-dependent 1H NMR spectra showing H−D exchange of the H7 etheno proton at 50 °C. The NMR spectra were recorded at 25 °C: (a) immediately after the sample was dissolved in buffer, (b) after 96 h, (c) after 216 h, and (d) after 576 h. (B) Change in the integrated intensity of H7 (5.84 ppm) and H6 (5.55 ppm) proton resonances with time. #The cytosine (C23) H5 proton resonance was taken as a reference.
Figure 6
Figure 6
1H NOESY spectrum (tile plot) showing the assignment of exocyclic etheno protons H7 and H6 and NOEs between the etheno and DNA protons. The NOESY spectrum was recorded at 25 °C with a mixing time of 250 ms: (a) X6 H7 → X6 H6, (b) X6 H7 → C18 H2′, (c) X6 H7 → C18 H2′′, (d) X6 H7 → A19 H5′/H5′′, (e) X6 H7 → C18 H5, (f) X6 H7 → C18 H1′, (g) X6 H7 → C18 H6, (h) X6 H7 → A19 H2, (i) X6 H6 → C18 H2′, (j) X6 H6 → C18 H2′′, (k) X6 H6 → A19 H5′/H5′′, (l) X6 H6 → A19 H5′/H5′′, (m) X6 H6 → A19 H4′, (n) X6 H6 → C18 H1′, (o) X6 H6 → A19 H1′, (p) X6 H6 → A19 H2, (q) X6 H6 → C18 H6, and (r) X6 H6 → A19 H8.
Figure 7
Figure 7
1H NOESY spectrum (tile plot) showing the NOEs between etheno protons and imino protons from neighboring base pairs. The NOESY spectrum was recorded at 7 °C with a mixing time of 250 ms.
Figure 8
Figure 8
Chemical shift differences observed for the 1-BD duplex when compared to those of the corresponding unmodified 1-BD duplex.
Figure 9
Figure 9
View of the central 5′-TXG-3′ segment of the 1-BD duplex as seen from the major groove.
Figure 10
Figure 10
View from the top of the helix showing stacking interactions on the central segment of the duplex. (A) Interaction between the T5·A19 and X6 base pairs. (B) Interaction between the X6 and G7·C18 base pairs.

Similar articles

Cited by

References

    1. Barbin A. (2000) Etheno-adduct-forming chemicals: From mutagenicity testing to tumor mutation spectra. Mutat. Res. 462, 55–69. - PubMed
    1. Barbin A.; Bresil H.; Croisy A.; Jacquignon P.; Malaveille C.; Montesano R.; Bartsch H. (1975) Liver-microsome-mediated formation of alkylating agents from vinyl bromide and vinyl chloride. Biochem. Biophys. Res. Commun. 67, 596–603. - PubMed
    1. Green T.; Hathway D. E. (1978) Interactions of vinyl chloride with rat-liver DNA in vivo. Chem.-Biol. Interact. 22, 211–224. - PubMed
    1. Eberle G.; Barbin A.; Laib R. J.; Ciroussel F.; Thomale J.; Bartsch H.; Rajewsky M. F. (1989) 1,N6-Etheno-2′-deoxyadenosine and 3,N4-etheno-2′-deoxycytidine detected by monoclonal antibodies in lung and liver DNA of rats exposed to vinyl chloride. Carcinogenesis 10, 209–212. - PubMed
    1. Fedtke N.; Boucheron J. A.; Walker V. E.; Swenberg J. A. (1990) Vinyl chloride-induced DNA adducts. II: Formation and persistence of 7-(2′-oxoethyl)guanine and N2,3-ethenoguanine in rat tissue DNA. Carcinogenesis 11, 1287–1292. - PubMed

Publication types

MeSH terms