

Organelle-targetable fluorescent probes for imaging hydrogen peroxide in living cells via SNAP-Tag protein labeling
- PMID: 20201528
- PMCID: PMC2850560
- DOI: 10.1021/ja100117u
Organelle-targetable fluorescent probes for imaging hydrogen peroxide in living cells via SNAP-Tag protein labeling
Abstract
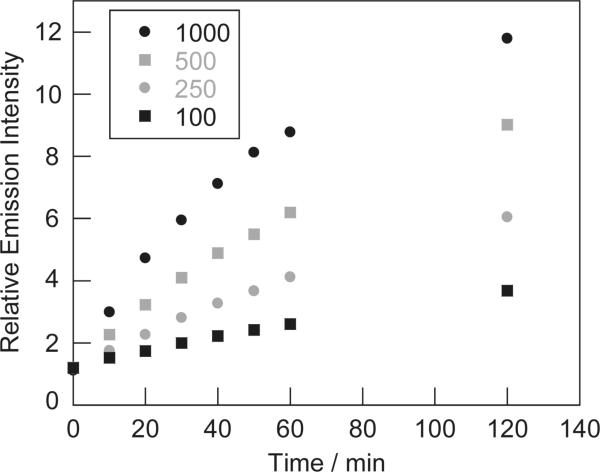
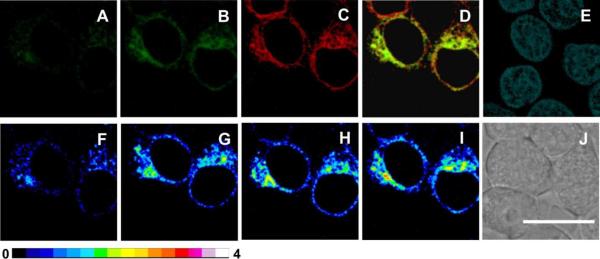
Hydrogen peroxide (H(2)O(2)) is a potent small-molecule oxidant that can exert a diverse array of physiological and/or pathological effects within living systems depending on the timing and location of its production, accumulation, trafficking, and consumption. To help study the chemistry and biology of this reactive oxygen species (ROS) in its native cellular context, we now present a new method for monitoring local, subcellular changes in H(2)O(2) levels by fluorescence imaging. Specifically, we have exploited the versatility of the SNAP-tag technology for site-specific protein labeling with small molecules on the surface or interior of living cells with the use of boronate-capped dyes to selectively visualize H(2)O(2). The resulting SNAP-Peroxy-Green (SNAP-PG) probes consist of appropriately derivatized boronates bioconjugated to SNAP-tag fusion proteins. Spectroscopic measurements of the SNAP-PG constructs confirm their ability to detect H(2)O(2) with specificity over other biologically relevant ROS. Moreover, these hybrid small-molecule/protein reporters can be used in live mammalian cells expressing SNAP-tag fusion proteins directed to the plasma membrane, nucleus, mitochondria, and endoplasmic reticulum. Imaging experiments using scanning confocal microscopy establish organelle-specific localization of the SNAP-tag probes and their fluorescence turn-on in response to changes in local H(2)O(2) levels. This work provides a general molecular imaging platform for assaying H(2)O(2) chemistry in living cells with subcellular resolution.
Figures


Comment in
-
SNAP-shots of hydrogen peroxide in cells.Chem Biol. 2010 Apr 23;17(4):318-9. doi: 10.1016/j.chembiol.2010.04.002. Chem Biol. 2010. PMID: 20416502 No abstract available.
Similar articles
-
Methods for detection and measurement of hydrogen peroxide inside and outside of cells.Mol Cells. 2010 Jun;29(6):539-49. doi: 10.1007/s10059-010-0082-3. Epub 2010 Jun 4. Mol Cells. 2010. PMID: 20526816 Review.
-
Visualization of phagosomal hydrogen peroxide production by a novel fluorescent probe that is localized via SNAP-tag labeling.Anal Chem. 2014 Jun 17;86(12):5983-90. doi: 10.1021/ac501041w. Epub 2014 Jun 6. Anal Chem. 2014. PMID: 24862209
-
Boronate oxidation as a bioorthogonal reaction approach for studying the chemistry of hydrogen peroxide in living systems.Acc Chem Res. 2011 Sep 20;44(9):793-804. doi: 10.1021/ar200126t. Epub 2011 Aug 11. Acc Chem Res. 2011. PMID: 21834525 Free PMC article.
-
Specifically and wash-free labeling of SNAP-tag fused proteins with a hybrid sensor to monitor local micro-viscosity.Biosens Bioelectron. 2017 May 15;91:313-320. doi: 10.1016/j.bios.2016.11.018. Epub 2016 Nov 10. Biosens Bioelectron. 2017. PMID: 27865110
-
Fluorescent probes for nitric oxide and hydrogen peroxide in cell signaling.Curr Opin Chem Biol. 2007 Dec;11(6):620-5. doi: 10.1016/j.cbpa.2007.09.018. Epub 2007 Nov 9. Curr Opin Chem Biol. 2007. PMID: 17967434 Free PMC article. Review.
Cited by
-
Boronate-based fluorescent probes: imaging hydrogen peroxide in living systems.Methods Enzymol. 2013;526:19-43. doi: 10.1016/B978-0-12-405883-5.00002-8. Methods Enzymol. 2013. PMID: 23791092 Free PMC article. Review.
-
Genetically Encoded Photocatalysis Enables Spatially Restricted Optochemical Modulation of Neurons in Live Mice.ACS Cent Sci. 2023 Dec 18;10(1):163-175. doi: 10.1021/acscentsci.3c01351. eCollection 2024 Jan 24. ACS Cent Sci. 2023. PMID: 38292609 Free PMC article.
-
Activity-Based Sensing for Chemistry-Enabled Biology: Illuminating Principles, Probes, and Prospects for Boronate Reagents for Studying Hydrogen Peroxide.ACS Bio Med Chem Au. 2022 Dec 21;2(6):548-564. doi: 10.1021/acsbiomedchemau.2c00052. Epub 2022 Oct 11. ACS Bio Med Chem Au. 2022. PMID: 36573097 Free PMC article. Review.
-
Chemical tags for labeling proteins inside living cells.Acc Chem Res. 2011 Sep 20;44(9):784-92. doi: 10.1021/ar200099f. Epub 2011 Aug 31. Acc Chem Res. 2011. PMID: 21879706 Free PMC article.
-
Systematic Evaluation of Bioorthogonal Reactions in Live Cells with Clickable HaloTag Ligands: Implications for Intracellular Imaging.J Am Chem Soc. 2015 Sep 9;137(35):11461-75. doi: 10.1021/jacs.5b06847. Epub 2015 Aug 31. J Am Chem Soc. 2015. PMID: 26270632 Free PMC article.
References
Publication types
MeSH terms
Substances
Grants and funding
LinkOut - more resources
Full Text Sources
Other Literature Sources
