

Whole-brain proton MR spectroscopic imaging of mild-to-moderate traumatic brain injury and correlation with neuropsychological deficits
- PMID: 20201668
- PMCID: PMC2867627
- DOI: 10.1089/neu.2009.1159
Whole-brain proton MR spectroscopic imaging of mild-to-moderate traumatic brain injury and correlation with neuropsychological deficits
Abstract
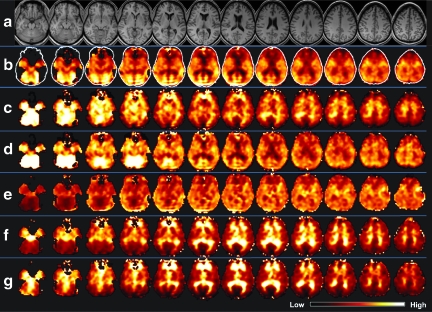
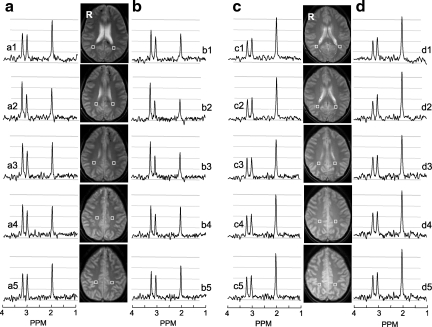
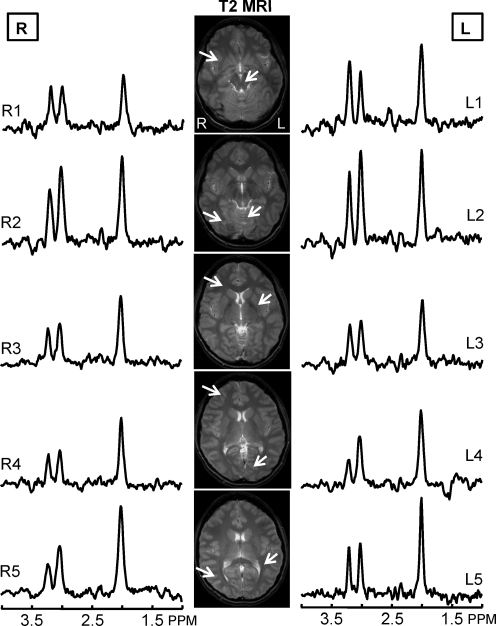
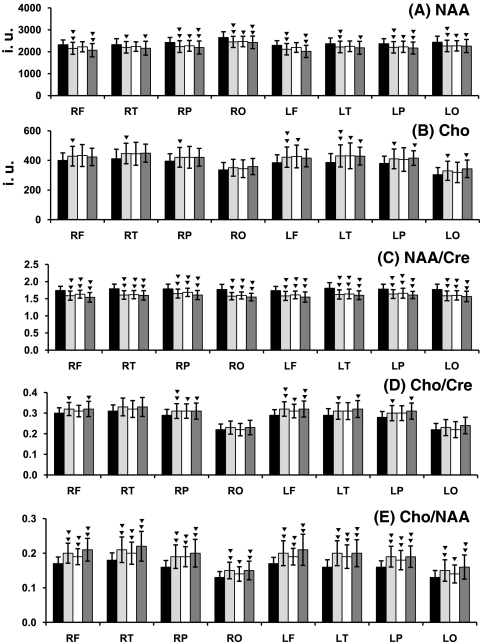
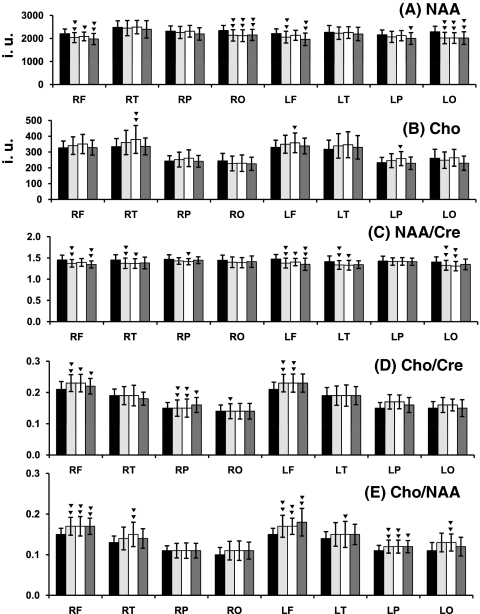
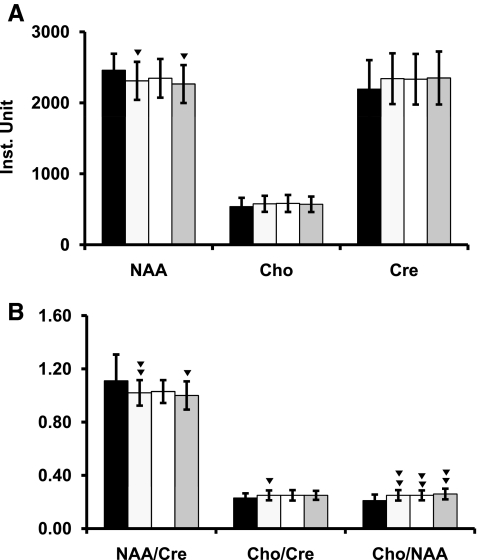
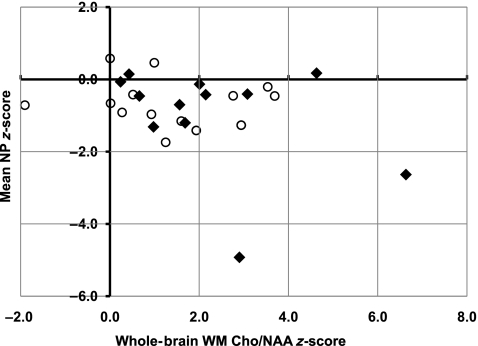
Changes in the distribution of the magnetic resonance (MR)-observable brain metabolites N-acetyl aspartate (NAA), total choline (Cho), and total creatine (Cre), following mild-to-moderate closed-head traumatic brain injury (mTBI) were evaluated using volumetric proton MR spectroscopic imaging (MRSI). Studies were carried out during the subacute time period following injury, and associations of metabolite indices with neuropsychological test (NPT) results were evaluated. Twenty-nine subjects with mTBI and Glasgow Coma Scale (GCS) scores of 10-15 were included. Differences in individual metabolite and metabolite ratio distributions relative to those of age-matched control subjects were evaluated, as well as analyses by hemispheric lobes and tissue types. Primary findings included a widespread decrease of NAA and NAA/Cre, and increases of Cho and Cho/NAA, within all lobes of the TBI subject group, and with the largest differences seen in white matter. Examination of the association between all of the metabolite measures and the NPT scores found the strongest negative correlations to occur in the frontal lobe and for Cho/NAA. No significant correlations were found between any of the MRSI or NPT measures and the GCS. These results demonstrate that significant and widespread alterations of brain metabolites occur as a result of mild-to-moderate TBI, and that these measures correlate with measures of cognitive performance.
Figures
Similar articles
-
Clinical correlations of proton magnetic resonance spectroscopy findings in acute phase after mild traumatic brain injury.Brain Inj. 2014;28(3):341-6. doi: 10.3109/02699052.2013.865270. Epub 2013 Dec 30. Brain Inj. 2014. PMID: 24377396
-
Metabolic levels in the corpus callosum and their structural and behavioral correlates after moderate to severe pediatric TBI.J Neurotrauma. 2010 Mar;27(3):473-81. doi: 10.1089/neu.2009.1058. J Neurotrauma. 2010. PMID: 19925210 Free PMC article.
-
Neurometabolite concentrations in gray and white matter in mild traumatic brain injury: an 1H-magnetic resonance spectroscopy study.J Neurotrauma. 2009 Oct;26(10):1635-43. doi: 10.1089/neu.2009.0896. J Neurotrauma. 2009. PMID: 19355814 Free PMC article.
-
Magnetic Resonance Spectroscopy following Mild Traumatic Brain Injury: A Systematic Review and Meta-Analysis on the Potential to Detect Posttraumatic Neurodegeneration.Neurodegener Dis. 2020;20(1):2-11. doi: 10.1159/000508098. Epub 2020 Jul 1. Neurodegener Dis. 2020. PMID: 32610337
-
Magnetic resonance spectroscopy in traumatic brain injury.J Head Trauma Rehabil. 2001 Apr;16(2):149-64. doi: 10.1097/00001199-200104000-00005. J Head Trauma Rehabil. 2001. PMID: 11275576 Review.
Cited by
-
Comprehensive evaluation of corticospinal tract metabolites in amyotrophic lateral sclerosis using whole-brain 1H MR spectroscopy.PLoS One. 2012;7(4):e35607. doi: 10.1371/journal.pone.0035607. Epub 2012 Apr 23. PLoS One. 2012. PMID: 22539984 Free PMC article.
-
Current Opportunities for Clinical Monitoring of Axonal Pathology in Traumatic Brain Injury.Front Neurol. 2017 Nov 20;8:599. doi: 10.3389/fneur.2017.00599. eCollection 2017. Front Neurol. 2017. PMID: 29209266 Free PMC article. Review.
-
Neuronal Cell Death Induced by Mechanical Percussion Trauma in Cultured Neurons is not Preceded by Alterations in Glucose, Lactate and Glutamine Metabolism.Neurochem Res. 2016 Feb;41(1-2):307-15. doi: 10.1007/s11064-015-1801-0. Epub 2016 Jan 4. Neurochem Res. 2016. PMID: 26729365 Free PMC article.
-
Longitudinal assessment of mitochondrial dysfunction in acute traumatic brain injury using hyperpolarized [1-13 C]pyruvate.Magn Reson Med. 2023 Dec;90(6):2432-2442. doi: 10.1002/mrm.29794. Epub 2023 Jul 10. Magn Reson Med. 2023. PMID: 37427535 Free PMC article.
-
Associations of age, gender and body mass with 1H MR-observed brain metabolites and tissue distributions.NMR Biomed. 2012 Apr;25(4):580-93. doi: 10.1002/nbm.1775. Epub 2011 Aug 19. NMR Biomed. 2012. PMID: 21858879 Free PMC article.
References
-
- Adams J.H. Doyle D. Ford I. Gennarelli T.A. Graham D.I. McLellan D.R. Diffuse axonal injury in head injury: definition, diagnosis and grading. Histopathology. 1989;15:49–59. - PubMed
-
- Baldo J.V. Shimamura A.P. Delis D.C. Kramer J. Kaplan E. Verbal and design fluency in patients with frontal lobe lesions. J. Int. Neuropsychol. Soc. 2001;7:586–596. - PubMed
-
- Bates T.E. Strangward M. Keelan J. Davey G.P. Munro P.M. Clark J.B. Inhibition of N-acetylaspartate production: implications for 1 H MRS studies in vivo. Neuroreport. 1996;7:1397–1400. - PubMed
-
- Belanger H.G. Vanderploeg R.D. Curtiss G. Warden D.L. Recent neuroimaging techniques in mild traumatic brain injury. J. Neuropsychiatry Clin. Neurosci. 2007;19:5–20. - PubMed
-
- Benson R.R. Meda S.A. Vasudevan S. Kou Z. Govindarajan K.A. Hanks R.A. Millis S.R. Makki M. Latif Z. Coplin W. Meythaler J. Haacke E.M. Global white matter analysis of diffusion tensor images is predictive of injury severity in traumatic brain injury. J. Neurotrauma. 2007;24:446–459. - PubMed
Publication types
MeSH terms
Substances
Grants and funding
LinkOut - more resources
Full Text Sources
