

Polyclonal expansion of cervical cytobrush-derived T cells to investigate HIV-specific responses in the female genital tract
- PMID: 20201983
- PMCID: PMC2855790
- DOI: 10.1111/j.1365-2567.2009.03172.x
Polyclonal expansion of cervical cytobrush-derived T cells to investigate HIV-specific responses in the female genital tract
Abstract
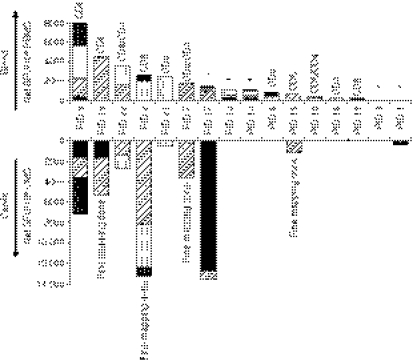
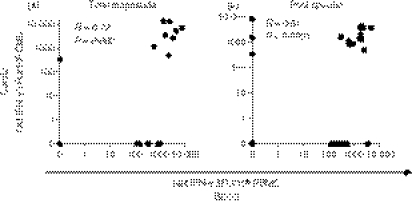
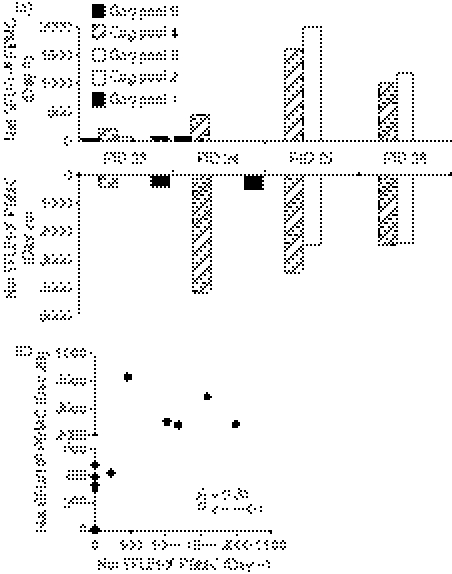
Human immunodeficiency virus (HIV) -specific T-cell responses are detectable in the female genital tract of HIV-infected women but little is known about their frequency or the factors that influence their detection. We investigated the feasibility of polyclonal in vitro expansion of cervical cytobrush-derived T cells to investigate HIV-specific responses in the female genital tract in HIV-infected women. Cytobrush-derived cervical cells were isolated from 22 HIV-infected women and expanded with anti-CD3 and recombinant interleukin-2. Cervical T-cell lines were investigated for Gag-specific responses by interferon-gamma ELISPOT and compared with those detected in matched blood samples. Cervical T-cell lines were established from 16/22 (72.7%) participants. Although the absolute number of CD3(+/-) cells recovered after expansion was positively associated with the number of cells isolated ex vivo (P = 0.01; R = 0.62), we observed a significant negative correlation between fold expansion and ex vivo cell number (P = 0.004; R = -0.68). We show that both the magnitude (P = 0.002; R = 0.7) and specific Gag regions targeted by cervical T-cell lines (P < 0.0001; R = 0.5) correlated significantly with those detected in blood. With one exception, cervical interferon-gamma T-cell responses to Gag were detected only in HIV-infected women with blood Gag-specific response > 1000 spot-forming units/10(6) cells. We conclude that cervical Gag-specific T-cell responses in expanded lines are most easily detectable in women who have corresponding high-magnitude Gag-specific T-cell responses in blood.
Figures

Similar articles
-
Stability and transport of cervical cytobrushes for isolation of mononuclear cells from the female genital tract.J Immunol Methods. 2011 Mar 31;367(1-2):47-55. doi: 10.1016/j.jim.2011.01.013. Epub 2011 Feb 12. J Immunol Methods. 2011. PMID: 21324321 Free PMC article.
-
HIV-specific T-cell responses detected in the genital tract of chronically HIV-infected women are largely monofunctional.Immunology. 2013 Jul;139(3):342-51. doi: 10.1111/imm.12084. Immunology. 2013. PMID: 23374084 Free PMC article.
-
Comparison of polyclonal expansion methods to improve the recovery of cervical cytobrush-derived T cells from the female genital tract of HIV-infected women.J Immunol Methods. 2010 Mar 31;354(1-2):68-79. doi: 10.1016/j.jim.2010.02.002. Epub 2010 Feb 8. J Immunol Methods. 2010. PMID: 20149794 Free PMC article.
-
Impact of mucosal inflammation on cervical human immunodeficiency virus (HIV-1)-specific CD8 T-cell responses in the female genital tract during chronic HIV infection.J Virol. 2008 Sep;82(17):8529-36. doi: 10.1128/JVI.00183-08. Epub 2008 Jun 18. J Virol. 2008. PMID: 18562528 Free PMC article.
-
Recent observations on HIV type-1 infection in the genital tract of men and women.AIDS. 2003 Mar 7;17(4):455-80. doi: 10.1097/00002030-200303070-00001. AIDS. 2003. PMID: 12598766 Review. No abstract available.
Cited by
-
Phase I randomised clinical trial of an HIV-1(CN54), clade C, trimeric envelope vaccine candidate delivered vaginally.PLoS One. 2011;6(9):e25165. doi: 10.1371/journal.pone.0025165. Epub 2011 Sep 30. PLoS One. 2011. PMID: 21984924 Free PMC article. Clinical Trial.
-
Vaccine applications of flow cytometry.Methods. 2012 Jul;57(3):383-91. doi: 10.1016/j.ymeth.2012.01.001. Epub 2012 Jan 10. Methods. 2012. PMID: 22251671 Free PMC article. Review.
-
Mucosal Immunity in HIV/SIV Infection: T Cells, B Cells and Beyond.Curr Immunol Rev. 2019;15(1):63-75. doi: 10.2174/1573395514666180528081204. Curr Immunol Rev. 2019. PMID: 31327960 Free PMC article.
-
Evaluation of Mucosal Humoral and Cellular Immune Responses to HIV in External Secretions and Mucosal Tissues.Curr Immunol Rev. 2019;15(1):41-48. doi: 10.2174/1573395514666180621152303. Curr Immunol Rev. 2019. PMID: 33312087 Free PMC article.
-
Stability and transport of cervical cytobrushes for isolation of mononuclear cells from the female genital tract.J Immunol Methods. 2011 Mar 31;367(1-2):47-55. doi: 10.1016/j.jim.2011.01.013. Epub 2011 Feb 12. J Immunol Methods. 2011. PMID: 21324321 Free PMC article.
References
-
- UNAIDS: Report on the Global AIDS epidemic . 2006. http://www.unaids.org/en/HIV_data/2006GlobalReport/default.asp [accessed on 26 May 2007]
-
- Prakash M, Patterson S, Kapembwa MS. Evaluation of the cervical cytobrush sampling technique for the preparation of CD45+ mononuclear cells from the human cervix. J Immunol Methods. 2001;258:37–46. - PubMed
-
- Addo MM, Yu XG, Rathod A, et al. Comprehensive epitope analysis of human immunodeficiency virus type 1 (HIV-1) -specific T-cell responses directed against the entire expressed HIV-1 genome demonstrate broadly directed responses, but no correlation to viral load. J Virol. 2003;77:2081–92. - PMC - PubMed
Publication types
MeSH terms
Substances
Grants and funding
LinkOut - more resources
Full Text Sources
Medical
