. 2010 Jun;130(2):273-87.
doi: 10.1111/j.1365-2567.2009.03233.x. Epub 2010 Feb 26.

Salmonella pathogenicity island 1 differentially modulates bacterial entry to dendritic and non-phagocytic cells

Affiliations

Salmonella pathogenicity island 1 differentially modulates bacterial entry to dendritic and non-phagocytic cells

Susan M Bueno et al. Immunology. 2010 Jun.

Abstract

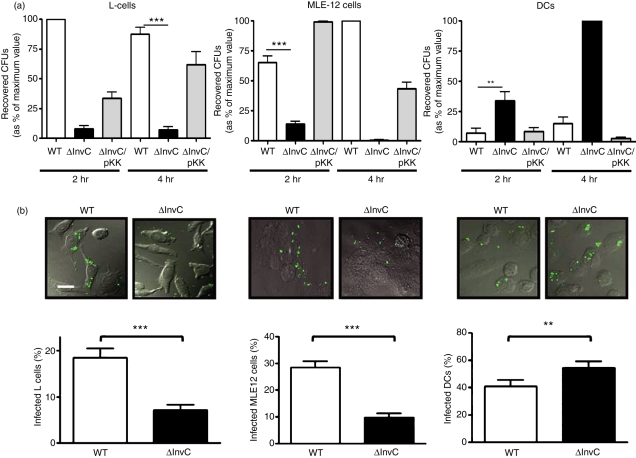
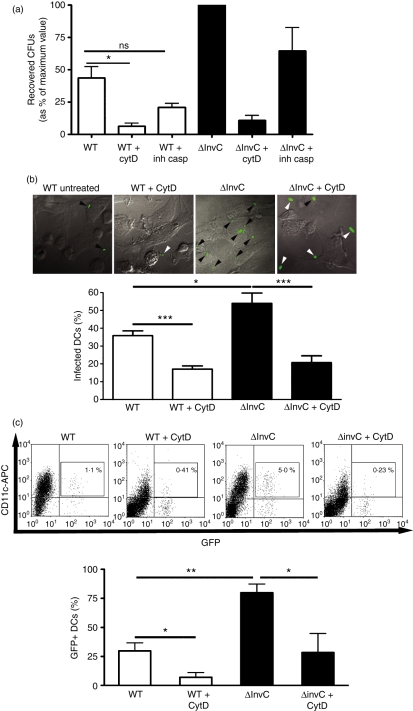
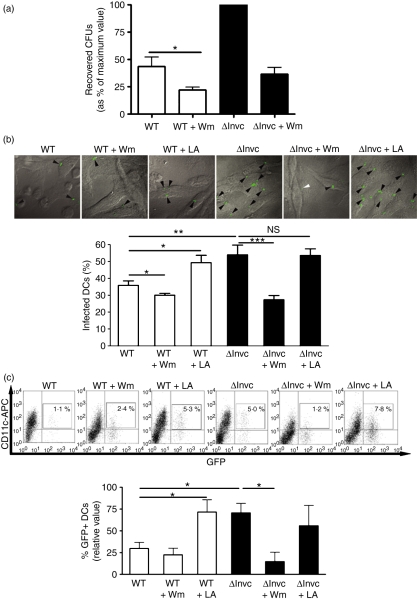
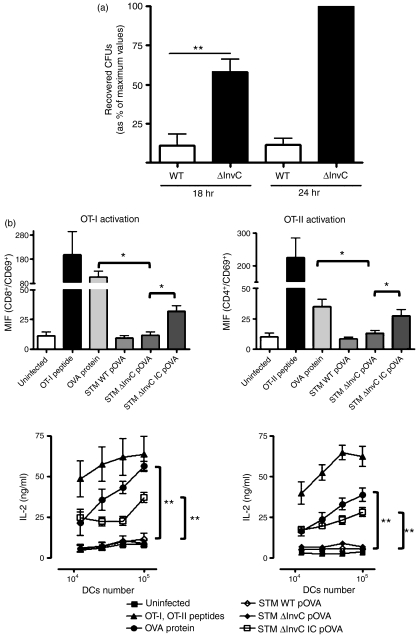
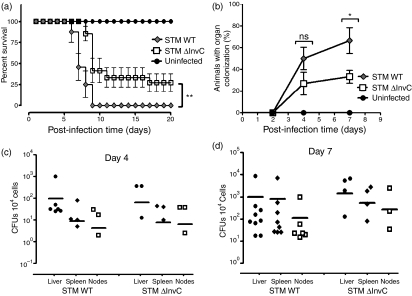
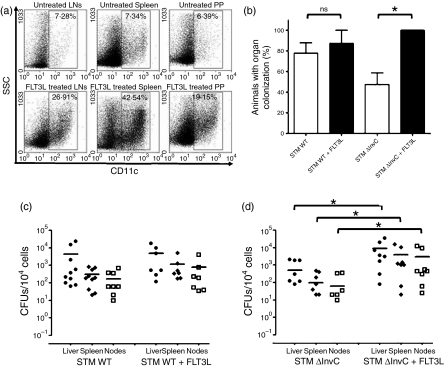
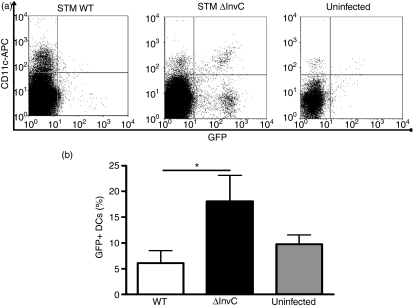
Salmonella enterica serovar Typhimurium can enter non-phagocytic cells, such as intestinal epithelial cells, by virtue of a Type Three Secretion System (TTSS) encoded in the Salmonella Pathogenicity Island 1 (SPI-1), which translocates bacterial effector molecules into the host cell. Salmonella can also be taken up by dendritic cells (DCs). Although the role of SPI-1 in non-phagocytic cell invasion is well established, its contribution to invasion of phagocytic cells has not been evaluated. Here, we have tested the invasive capacity of a S. Typhimurium strain lacking a key component of its TTSS-1 (DeltaInvC) leading to defective translocation of SPI-1-encoded effectors. Whereas this mutant Salmonella strain was impaired for invasion of non-phagocytic cells, it was taken up by DCs at a significantly higher rate than wild-type Salmonella. Similar to wild-type Salmonella, the DeltaInvC mutant strain retained the capacity to avoid antigen presentation to T cells. However, mice infected with the DeltaInvC mutant strain showed higher survival rate and reduced organ colonization. Our data suggest that, besides promoting phagocytosis by non-phagocytic cells, SPI-1 modulates the number of bacteria that enters DCs. The SPI-1 could be considered not only as an inducer of epithelial cell invasion but as a controller of DC entry.


Figures

Figure 1
Figure 1
ΔInvC Salmonella fails to enter non-phagocytic cells but shows increased entry into dendritic cells (DCs). (a) Intracellular survival rates for each Salmonella strain in L cells, MLE-12 cells or DCs. Cells were infected with wild-type (WT), ΔInvC or ΔInvC/pKK233.2-invC (ΔInvC/pKK) Salmonella strains (multiplicity of infection = 25) and, at the indicated times, intracellular bacteria were released from DCs and seeded on Luria–Bertani agar plates. After 12 hr of incubation at 37°, colonies were counted. Colony-forming units (CFUs) were expressed as a percentage of the maximum value for each experiment (as described in the Material and methods section). (b) Internalization of bacteria analysed by confocal microscopy. L cells, MLE-12 cells and DCs and were infected with either WT or ΔInvC Salmonella (multiplicity of infection = 50). Bacterial internalization was quantified for L cells, MLE-12 cells and DCs by analysing several random fields and counting bacteria-infected cells in at least 300 cells per bacterial strain (lower graphs). Representative microphotographs are shown above each graphic. Bar in the microphotograph represents 10 μm. Data are means of two or three independent experiments and bars represent SE (Student’s t-test: *P < 0·05; **P < 0·01; ***P < 0·001).
Figure 2
Figure 2
Enhanced ΔinvC Salmonella entry to dendritic cells (DCs) is not the result of reduced DC death and requires cytoskeletal rearrangement. (a) DCs were treated with the pan-caspase inhibitor VI Z-VAD FMK (casp inh) for 30 min or with cytochalasin D (CytD) for 10 min and then infected with either wild-type (WT) or ΔinvC Salmonella. After 2 hr, DCs were lysed and intracellular bacteria were seeded on Luria–Bertani agar to determine intracellular colony-forming units (CFUs). CFUs were expressed as a percentage of the maximum value for each experiment (as described in the Material and methods section). Data are means of three independent experiments and bars are SE. (b) DCs were treated with cytochalasin D for 10 min and then infected with either WT or ΔinvC Salmonella expressing green fluorescent protein (GFP). After 1 hr of infection and 3 hr of gentamicin treatment, DCs were washed, fixed and analysed by confocal microscopy to detect bacteria-infected DCs. Representative microphotographs are shown. Bar graph shows the mean of infected DCs in three independent experiments (at least 300 cells analysed). (c) DCs treated or not with cytochalasin D were infected with either WT or ΔinvC Salmonella expressing GFP. After 2 hr, DCs were stained with an allophycocyanin-conjugated anti-mouse CD11c antibody and infected cells (CD11c+/GFP+) were detected by flow cytometry. Representative dot plots are shown and the bar graph shows percentages of infected CD11c+/GFP+ cells. Data are means of three independent experiments. Bars are SE. Student’s t-test: *P = 0·05; **P = 0·01; ***P = 0·001.
Figure 3
Figure 3
Increased entry of ΔinvC Salmonella to dendritic cells (DCs) requires phosphoinositide 3-kinase (PI3-K) activity. (a) DCs were treated for 30 min with Wortmannin (Wm) and then infected with either wild-type (WT) or ΔinvC Salmonella. After 2 hr of infection, DCs were lysed and intracellular bacteria were seeded on Luria–Bertani agar to determine amounts of intracellular colony-forming units (CFUs). Graph shows means of relative amounts of CFUs, expressed as a percentage of the maximum value for each experiment (as described in the Material and methods section). Bars represent SE. (b) DCs treated for 30 min with Wm or α-1-lipoic acid (LA) were infected for 2 hr with WT or ΔinvC Salmonella strains expressing green fluorescent protein (GFP). Then, DCs were fixed and analysed by confocal microscopy. Representative microphotographs (100 × magnification) for each treatment are shown. The graph shows the quantification of infected cells in three independent experiments. At least 300 cells for each treatment were analysed per experiment. Bars represent SE. (c) DCs were treated for 30 min with either Wm or LA and then infected with Salmonella strains expressing GFP. After 2 hr of infection, CD11c+/GFP+ cells were quantified by flow cytometry. Representative dot plots are shown and the bar graph shows mean values from three independent experiments. Student’s t-test: *P = 0·05; **P = 0·01; ***P = 0·001.
Figure 4
Figure 4
ΔInvC Salmonella retains the capacity to keep dendritic cells (DCs) from activating T cells. (a) DCs were infected with wild-type (WT) or ΔInvC Salmonella for 1 hr and then treated with 50 μg/ml gentamicin. After 18 and 24 hr, DCs were lysed and intracellular Salmonella was seeded in Luria–Bertani agar to determine the colony-forming units (CFUs). Graph shows means of relative amounts of CFUs, expressed as a percentage of the maximum value for each experiment (as described in the Material and methods section) and bars are SE. (b) DCs were infected either with WT or ΔInvC Salmonella expressing ovalbumin (OVA) and co-cultured with OT-I or OT-II T cells. CD69 expression (upper panels) and interleukin-2 (IL-2) secretion (lower panels) was determined after 12 hr. As positive controls, DCs were pulsed with 10 μg/ml of OVA or the respective OT-I and OT-II peptides (2·5 ng/ml). To control that while being inside DCs, bacteria express OVA, DCs were pulsed with immunoglobulin G-opsonized ΔInvC Salmonella expressing OVA. The observed restoration of DCs capacity to activate OVA-specific T cells indicates that impairment of T-cell activation by ΔInvC Salmonella expressing OVA is not the result of a lack of OVA expression by the bacteria. Data shown are means of three independent experiments. Bars represent SE. Student’s t-test: *P < 0·05, **P < 0·01.
Figure 5
Figure 5
ΔInvC Salmonella is only mildly attenuated in vivo. (a) Mice infected with ΔInvC Salmonella showed extended survival as compared to mice infected with wild-type (WT) Salmonella. C57BL/6 mice were orally infected with 105 bacteria and survival was registered daily. Mice treated with vehicle were included as controls. (b) Mice infected with ΔInvC Salmonella showed reduced organ colonization at 4 and 7 days post-infection, as compared to mice infected with WT Salmonella. To determine organ colonization capacity, mice were killed at day 4 or 7 after infection and their liver, spleen and mesenteric lymph nodes were lysed and plated for intracellular bacterial count. (c, d) Bacterial colonization for individual organs at 4 days (c) and 7 days (d) post-infection with either WT or ΔInvC Salmonella. Survival and organ colonization experiments were repeated at least three times for each strain. At least four mice per group were included in each experiment. Bars represent SE (Student’s t-test: *P < 0·05; **P < 0·01).
Figure 6
Figure 6
An increase in dendritic cell (DC) frequency by FLT3 ligand treatment improves organ colonization by ΔInvC Salmonella. (a) Representative dot plots showing the percentage of CD11c positive cells in spleen, mesenteric lymph nodes and Peyer’s patches obtained from control (upper pannels) and FLT3 ligand-treated mice (lower pannels). (b) FLT3 ligand-treated mice showed an increased colonization of organs at 7 days post-infection only when they were infected with ΔInvC Salmonella strain, compared with mice infected with WT Salmonella. (c, d) Bacterial colonization in liver, spleen and lymph nodes of control and FLT3 ligand-treated mice at 7 days post-infection with either WT (c) or ΔInvC (d) Salmonella. Data shown are means of two independent experiments, including at least five mice per group. Bars represent SE (Student’s t-test: *P ≤ 0·05).
Figure 7
Figure 7
Mice infected with ΔInvC Salmonella show higher numbers of bacteria-containing Peyer’s patch dendritic cells (PP DCs). Mice were orally infected with 107 colony-forming units (CFU) of either wild-type (WT) or ΔInvC Salmonella expressing green fluorescent protein (GFP). After 6 hr of infection, PPs were recovered, single cell suspensions were obtained and DCs were stained with an allophycocyanin-conjugated anti-mouse CD11c antibody. (a) Representative dot plots are shown for PP DCs obtained from mice infected with WT Salmonella, ΔInvC Salmonella or from uninfected mice. (b) Graph shows the percentage of CD11c+/GFP+ cells in PPs after Salmonella infection. Data are means of three independent experiments, including at least three mice per group, and bars represent SE. Student’s t-test: *P = 0·05.

Similar articles

Cited by

References

    1. Ohl ME, Miller SI. Salmonella: a model for bacterial pathogenesis. Annu Rev Med. 2001;52:259–74. - PubMed
    1. Clark MA, Jepson MA, Simmons NL, Hirst BH. Preferential interaction of Salmonella typhimurium with mouse Peyer’s patch M cells. Res Microbiol. 1994;145:543–52. - PubMed
    1. Jepson MA, Clark MA. The role of M cells in Salmonella infection. Microbes Infect. 2001;3:1183–90. - PubMed
    1. Hopkins SA, Niedergang F, Corthesy-Theulaz IE, Kraehenbuhl JP. A recombinant Salmonella typhimurium vaccine strain is taken up and survives within murine Peyer’s patch dendritic cells. Cell Microbiol. 2000;2:59–68. - PubMed
    1. Jepson MA, Collares-Buzato CB, Clark MA, Hirst BH, Simmons NL. Rapid disruption of epithelial barrier function by Salmonella typhimurium is associated with structural modification of intercellular junctions. Infect Immun. 1995;63:356–9. - PMC - PubMed

Publication types

MeSH terms

Substances

LinkOut - more resources