Monitoring the regulation of gene expression in a growing organ using a fluid mechanics formalism
- PMID: 20202192
- PMCID: PMC2845557
- DOI: 10.1186/1741-7007-8-18
Monitoring the regulation of gene expression in a growing organ using a fluid mechanics formalism
Abstract
Background: Technological advances have enabled the accurate quantification of gene expression, even within single cell types. While transcriptome analyses are routinely performed, most experimental designs only provide snapshots of gene expression. Molecular mechanisms underlying cell fate or positional signalling have been revealed through these discontinuous datasets. However, in developing multicellular structures, temporal and spatial cues, known to directly influence transcriptional networks, get entangled as the cells are displaced and expand. Access to an unbiased view of the spatiotemporal regulation of gene expression occurring during development requires a specific framework that properly quantifies the rate of change of a property in a moving and expanding element, such as a cell or an organ segment.
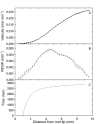
Results: We show how the rate of change in gene expression can be quantified by combining kinematics and real-time polymerase chain reaction data in a mechanistic model which considers any organ as a continuum. This framework was applied in order to assess the developmental regulation of the two reference genes Actin11 and Elongation Factor 1-beta in the apex of poplar root. The growth field was determined by time-lapse photography and transcript density was obtained at high spatial resolution. The net accumulation rates of the transcripts of the two genes were found to display highly contrasted developmental profiles. Actin11 showed pulses of up and down regulation in the accelerating and decelerating parts of the growth zone while the dynamic of EF1beta were much slower. This framework provides key information about gene regulation in a developing organ, such as the location, the duration and the intensity of gene induction/repression.
Conclusions: We demonstrated that gene expression patterns can be monitored using the continuity equation without using mutants or reporter constructions. Given the rise of imaging technologies, this framework in our view opens a new way to dissect the molecular basis of growth regulation, even in non-model species or complex structures.
Figures


Similar articles
-
Two WUSCHEL-related HOMEOBOX genes, PeWOX11a and PeWOX11b, are involved in adventitious root formation of poplar.Physiol Plant. 2015 Dec;155(4):446-56. doi: 10.1111/ppl.12349. Epub 2015 Jun 22. Physiol Plant. 2015. PMID: 25998748
-
MAP-ping genomic organization and organ-specific expression profiles of poplar MAP kinases and MAP kinase kinases.BMC Genomics. 2006 Aug 31;7:223. doi: 10.1186/1471-2164-7-223. BMC Genomics. 2006. PMID: 16945144 Free PMC article.
-
[Observation of prime position and driving zones in process of tuberous root expanding and expression analysis of phytohormone relative genes in Rehmannia glutinosa].Zhongguo Zhong Yao Za Zhi. 2014 Sep;39(17):3245-53. Zhongguo Zhong Yao Za Zhi. 2014. PMID: 25522605 Chinese.
-
Adventitious root formation in tree species: involvement of transcription factors.Physiol Plant. 2014 Jun;151(2):192-8. doi: 10.1111/ppl.12197. Physiol Plant. 2014. PMID: 24666319 Review.
-
Digging deeper: high-resolution genome-scale data yields new insights into root biology.Curr Opin Plant Biol. 2015 Apr;24:24-30. doi: 10.1016/j.pbi.2015.01.007. Epub 2015 Jan 27. Curr Opin Plant Biol. 2015. PMID: 25636037 Review.
Cited by
-
Non-invasive Protocol for Kinematic Monitoring of Root Growth under Infrared Light.Bio Protoc. 2017 Jul 20;7(14):e2390. doi: 10.21769/BioProtoc.2390. eCollection 2017 Jul 20. Bio Protoc. 2017. PMID: 34541126 Free PMC article.
-
Molecular basis of differential adventitious rooting competence in poplar genotypes.J Exp Bot. 2022 Jun 24;73(12):4046-4064. doi: 10.1093/jxb/erac126. J Exp Bot. 2022. PMID: 35325111 Free PMC article.
-
3D deformation field in growing plant roots reveals both mechanical and biological responses to axial mechanical forces.J Exp Bot. 2016 Oct;67(19):5605-5614. doi: 10.1093/jxb/erw320. Epub 2016 Sep 24. J Exp Bot. 2016. PMID: 27664958 Free PMC article.
-
A unifying modeling of plant shoot gravitropism with an explicit account of the effects of growth.Front Plant Sci. 2014 Apr 14;5:136. doi: 10.3389/fpls.2014.00136. eCollection 2014. Front Plant Sci. 2014. PMID: 24782876 Free PMC article.
-
The build-up of osmotic stress responses within the growing root apex using kinematics and RNA-sequencing.J Exp Bot. 2016 Nov;67(21):5961-5973. doi: 10.1093/jxb/erw350. Epub 2016 Oct 4. J Exp Bot. 2016. PMID: 27702994 Free PMC article.
References
Publication types
MeSH terms
Substances
LinkOut - more resources
Full Text Sources
Miscellaneous

