

Distribution of the main malaria vectors in Kenya
- PMID: 20202199
- PMCID: PMC2845185
- DOI: 10.1186/1475-2875-9-69
Distribution of the main malaria vectors in Kenya
Abstract
Background: A detailed knowledge of the distribution of the main Anopheles malaria vectors in Kenya should guide national vector control strategies. However, contemporary spatial distributions of the locally dominant Anopheles vectors including Anopheles gambiae, Anopheles arabiensis, Anopheles merus, Anopheles funestus, Anopheles pharoensis and Anopheles nili are lacking. The methods and approaches used to assemble contemporary available data on the present distribution of the dominant malaria vectors in Kenya are presented here.
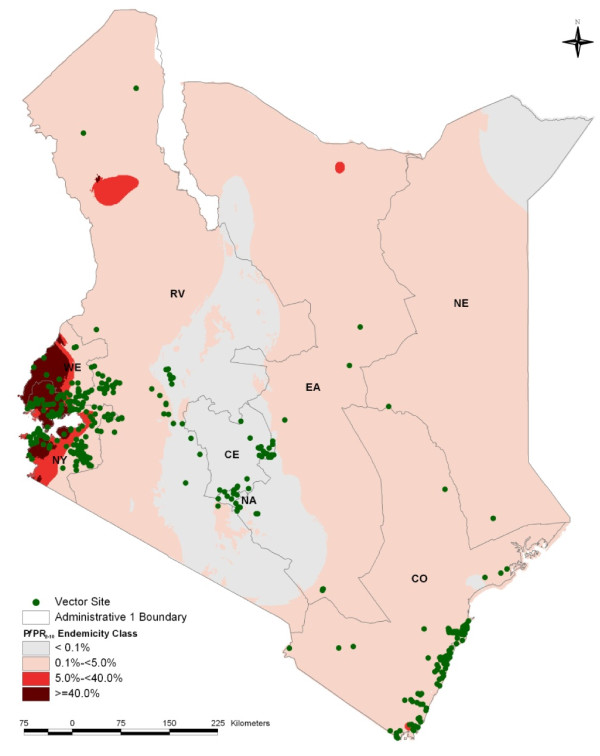
Method: Primary empirical data from published and unpublished sources were identified for the period 1990 to 2009. Details recorded for each source included the first author, year of publication, report type, survey location name, month and year of survey, the main Anopheles species reported as present and the sampling and identification methods used. Survey locations were geo-positioned using national digital place name archives and on-line geo-referencing resources. The geo-located species-presence data were displayed and described administratively, using first-level administrative units (province), and biologically, based on the predicted spatial margins of Plasmodium falciparum transmission intensity in Kenya for the year 2009. Each geo-located survey site was assigned an urban or rural classification and attributed an altitude value.
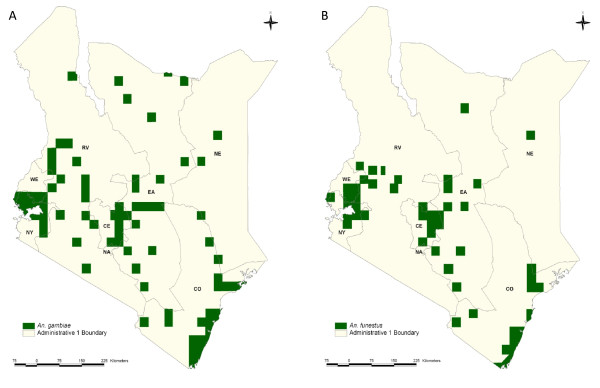
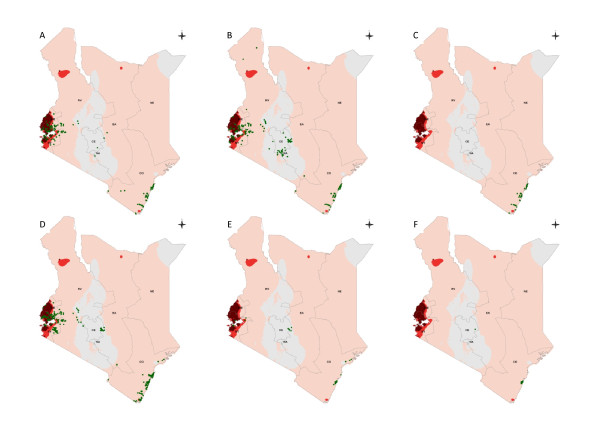
Results: A total of 498 spatially unique descriptions of Anopheles vector species across Kenya sampled between 1990 and 2009 were identified, 53% were obtained from published sources and further communications with authors. More than half (54%) of the sites surveyed were investigated since 2005. A total of 174 sites reported the presence of An. gambiae complex without identification of sibling species. Anopheles arabiensis and An. funestus were the most widely reported at 244 and 265 spatially unique sites respectively with the former showing the most ubiquitous distribution nationally. Anopheles gambiae, An. arabiensis, An. funestus and An. pharoensis were reported at sites located in all the transmission intensity classes with more reports of An. gambiae in the highest transmission intensity areas than the very low transmission areas.
Conclusion: A contemporary, spatially defined database of the main malaria vectors in Kenya provides a baseline for future compilations of data and helps identify areas where information is currently lacking. The data collated here are published alongside this paper where it may help guide future sampling location decisions, help with the planning of vector control suites nationally and encourage broader research inquiry into vector species niche modeling.
Figures
Similar articles
-
Seasonal density, sporozoite rates and entomological inoculation rates of Anopheles gambiae and Anopheles funestus in a high-altitude sugarcane growing zone in Western Kenya.Trop Med Int Health. 1998 Sep;3(9):706-10. doi: 10.1046/j.1365-3156.1998.00282.x. Trop Med Int Health. 1998. PMID: 9754665
-
Environmental factors associated with the malaria vectors Anopheles gambiae and Anopheles funestus in Kenya.Malar J. 2009 Nov 26;8:268. doi: 10.1186/1475-2875-8-268. Malar J. 2009. PMID: 19941637 Free PMC article.
-
Spatial and temporal heterogeneity of Anopheles mosquitoes and Plasmodium falciparum transmission along the Kenyan coast.Am J Trop Med Hyg. 2003 Jun;68(6):734-42. Am J Trop Med Hyg. 2003. PMID: 12887036
-
Malaria entomological profile in Tanzania from 1950 to 2010: a review of mosquito distribution, vectorial capacity and insecticide resistance.Tanzan J Health Res. 2011 Dec;13(5 Suppl 1):319-31. Tanzan J Health Res. 2011. PMID: 26591987 Review.
-
Biology, distribution and control of Anopheles (Cellia) minimus in the context of malaria transmission in northeastern India.Parasit Vectors. 2016 Nov 15;9(1):585. doi: 10.1186/s13071-016-1878-6. Parasit Vectors. 2016. PMID: 27846911 Free PMC article. Review.
Cited by
-
Patient adherence to prescribed artemisinin-based combination therapy in Garissa County, Kenya, after three years of health care in a conflict setting.Malar J. 2015 Mar 24;14:125. doi: 10.1186/s12936-015-0645-z. Malar J. 2015. PMID: 25888895 Free PMC article.
-
Improving the population genetics toolbox for the study of the African malaria vector Anopheles nili: microsatellite mapping to chromosomes.Parasit Vectors. 2011 Oct 19;4:202. doi: 10.1186/1756-3305-4-202. Parasit Vectors. 2011. PMID: 22011455 Free PMC article.
-
Urban malaria in sub-Saharan Africa: dynamic of the vectorial system and the entomological inoculation rate.Malar J. 2021 Sep 8;20(1):364. doi: 10.1186/s12936-021-03891-z. Malar J. 2021. PMID: 34493280 Free PMC article. Review.
-
Effects of bacterial composition and aquatic habitat metabolites on malaria vector larval availability in irrigated and non-irrigated sites of Homa Bay county, western Kenya.PLoS One. 2023 Jun 2;18(6):e0286509. doi: 10.1371/journal.pone.0286509. eCollection 2023. PLoS One. 2023. PMID: 37267284 Free PMC article.
-
'A bite before bed': exposure to malaria vectors outside the times of net use in the highlands of western Kenya.Malar J. 2015 Jun 25;14:259. doi: 10.1186/s12936-015-0766-4. Malar J. 2015. PMID: 26109384 Free PMC article.
References
-
- Gillies MT, Coetzee M. A Supplement to the Anophelinae of Africa South of the Sahara. Vol. 55. Johannesburg: The South African Institute for Medical Research; 1987.
-
- Gillies MT, de Meillon B. The Anophelinae of Africa South of the Sahara (Ethiopian zoogeographical region) Vol. 54. Johannesburg: The South African Institute for Medical Research; 1968.
Publication types
MeSH terms
Grants and funding
LinkOut - more resources
Full Text Sources
