. 2010 Mar 4:9:50.
doi: 10.1186/1476-4598-9-50.

Cell cycle-dependent regulation of the bi-directional overlapping promoter of human BRCA2/ZAR2 genes in breast cancer cells

Affiliations

Cell cycle-dependent regulation of the bi-directional overlapping promoter of human BRCA2/ZAR2 genes in breast cancer cells

Smita Misra et al. Mol Cancer. .

Abstract

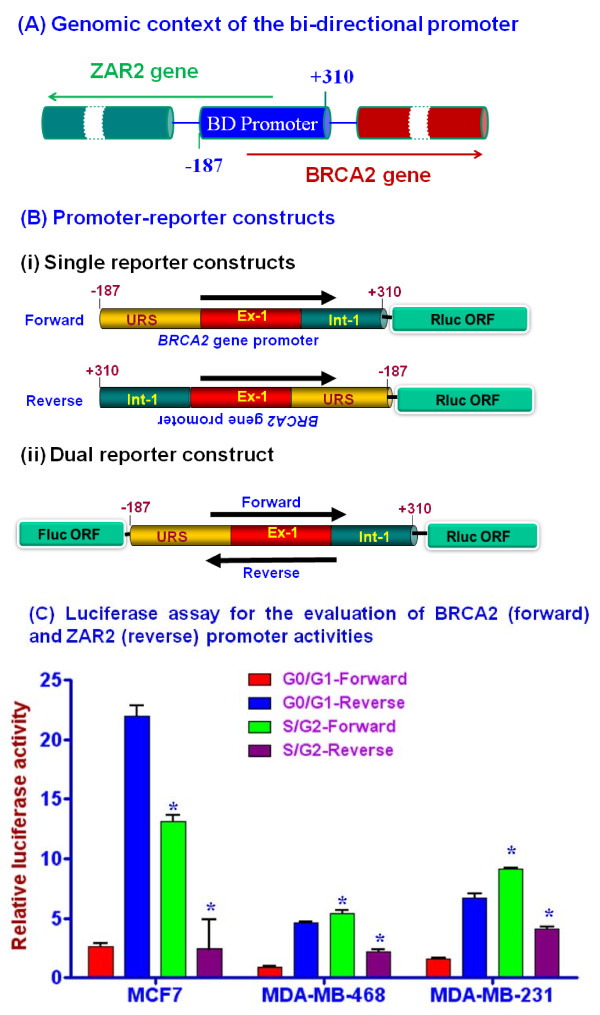
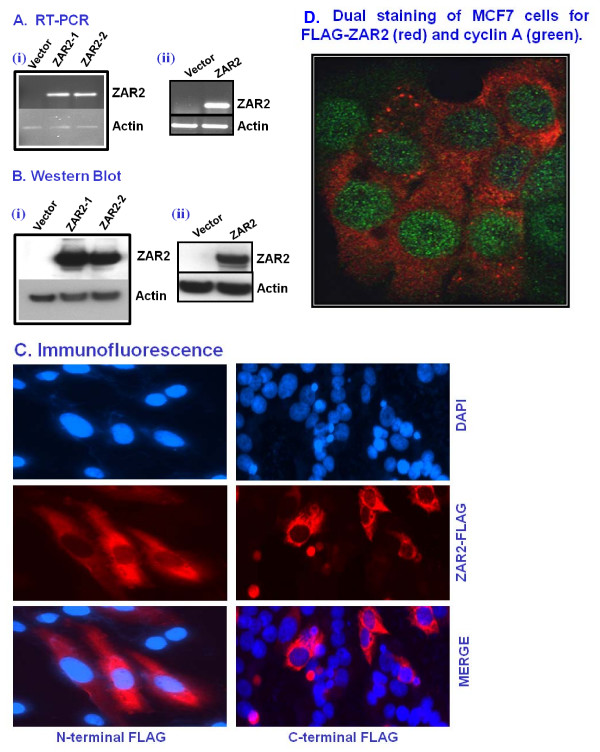
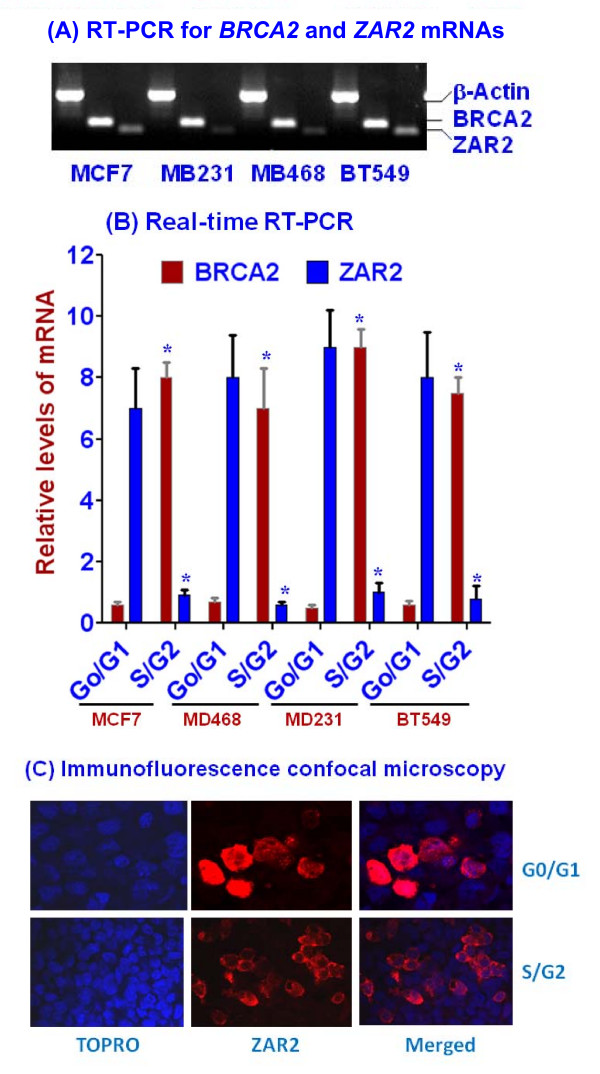
Background: BRCA2 gene expression is tightly regulated during the cell cycle in human breast cells. The expression of BRCA2 gene is silenced at the G0/G1 phase of cell growth and is de-silenced at the S/G2 phase. While studying the activity of BRCA2 gene promoter in breast cancer cells, we discovered that this promoter has bi-directional activity and the product of the reverse activity (a ZAR1-like protein, we named ZAR2) silences the forward promoter at the G0/G1 phase of the cell. Standard techniques like cell synchronization by serum starvation, flow cytometry, N-terminal or C-terminal FLAG epitope-tagged protein expression, immunofluorescence confocal microscopy, dual luciferase assay for promoter evaluation, and chromatin immunoprecipitation assay were employed during this study.

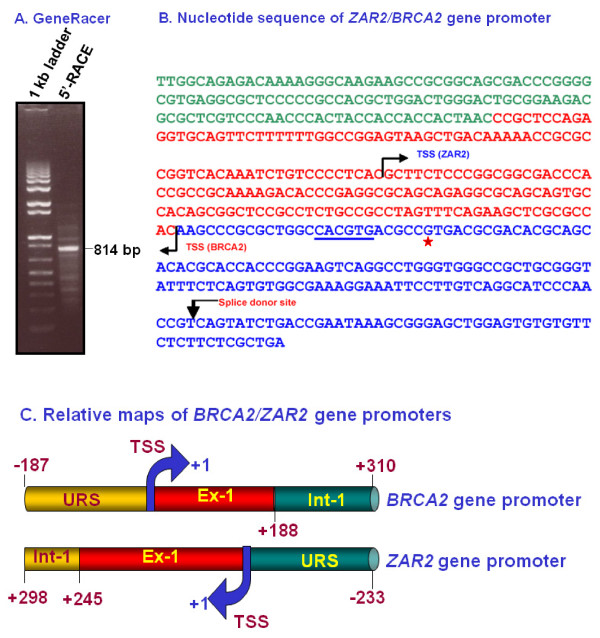
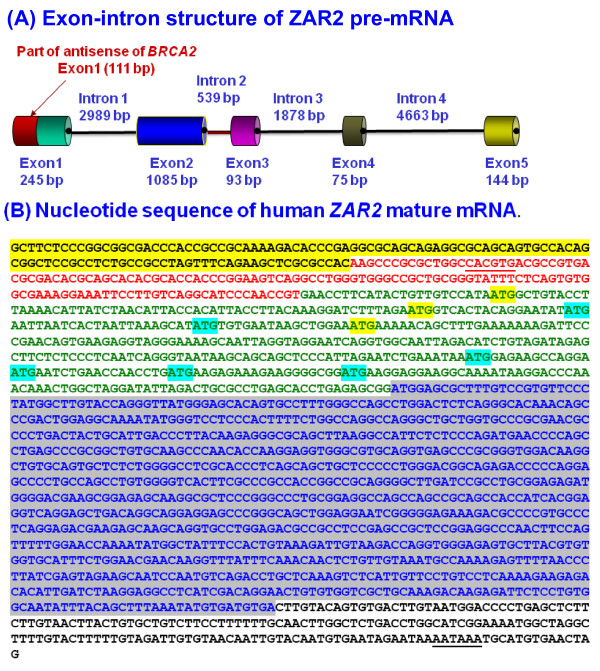
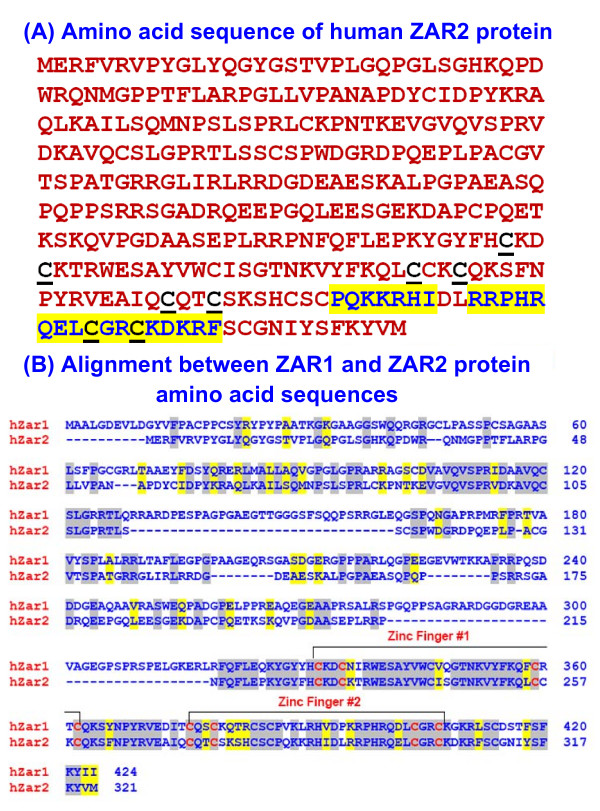
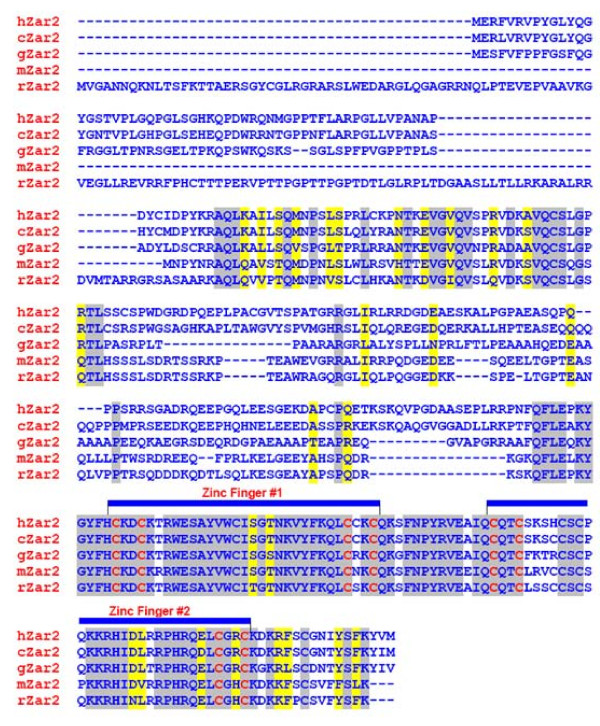
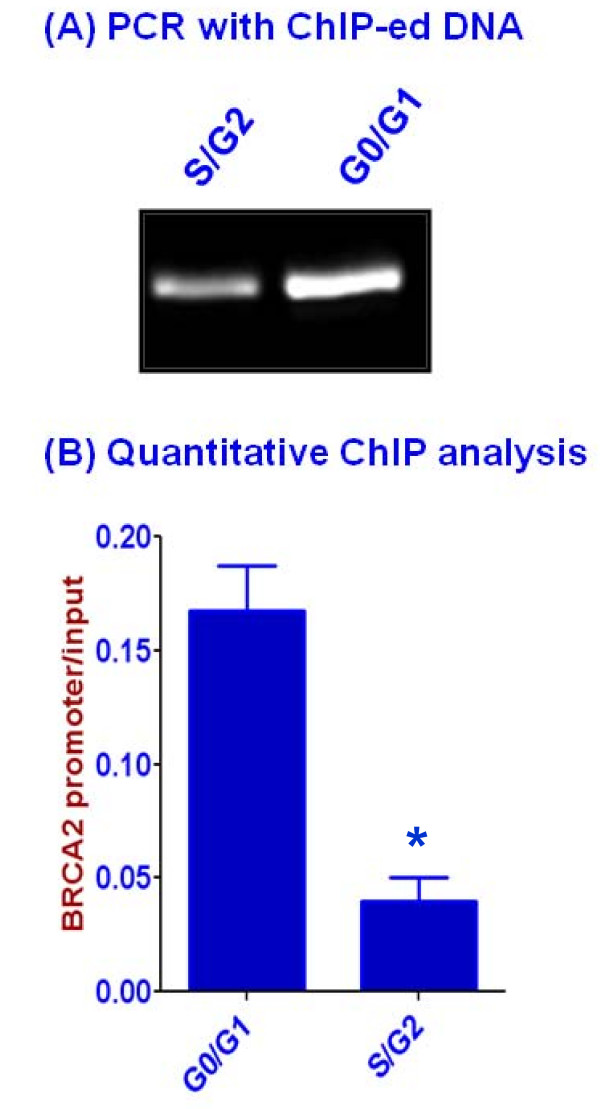
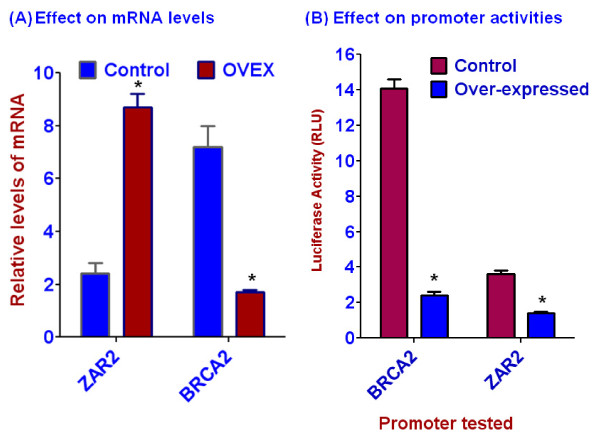
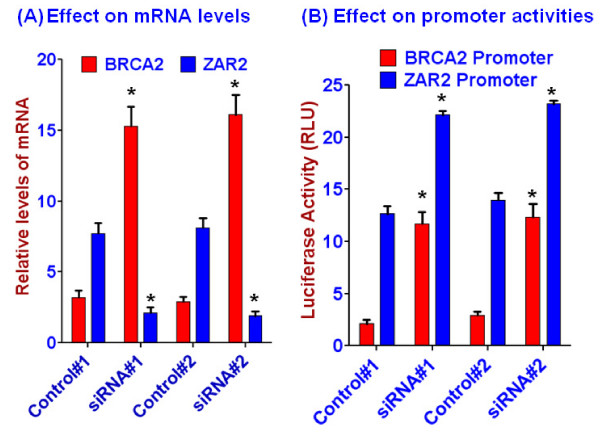
Results: Human BRCA2 gene promoter is active in both the forward and the reverse orientations. This promoter is 8-20 fold more active in the reverse orientation than in the forward orientation when the cells are in the non-dividing stage (G0/G1). When the cells are in the dividing state (S/G2), the forward activity of the promoter is 5-8 folds higher than the reverse activity. The reverse activity transcribes the ZAR2 mRNA with 966 nt coding sequence which codes for a 321 amino acid protein. ZAR2 has two C4 type zinc fingers at the carboxyl terminus. In the G0/G1 growth phase ZAR2 is predominantly located inside the nucleus of the breast cells, binds to the BRCA2 promoter and inhibits the expression of BRCA2. In the dividing cells, ZAR2 is trapped in the cytoplasm.

Conclusions: BRCA2 gene promoter has bi-directional activity, expressing BRCA2 and a novel C4-type zinc finger containing transcription factor ZAR2. Subcellular location of ZAR2 and its expression from the reverse promoter of the BRCA2 gene are stringently regulated in a cell cycle dependent manner. ZAR2 binds to BRCA2/ZAR2 bi-directional promoter in vivo and is responsible, at least in part, for the silencing of BRCA2 gene expression in the G0/G1 phase in human breast cells.


Figures

Figure 1
Figure 1
Cell cycle dependent bi-directional activities of human BRCA2 gene promoter. (A) Genomic context of human BRCA2 gene bi-directional (BD) promoter studied. The numbers shown are with respect to the transcription start site of human BRCA2 gene. (B) Maps of the reporter constructs in pRL-Null vector used in the study. (i) The single reporter constructs: pRL-FP (forward construct) and pRL-RP (reverse construct); (ii) the dual reporter construct. URS: upstream regulatory sequence; Ex-1: exon 1; Int-1: intron 1; Rluc: Renilla luciferase; Fluc: firefly luciferase; ORF: open reading frame. (C) Activities of the BRCA2 (forward) and the ZAR2 (reverse) promoters in different lines of human breast cancer cells at G0/G1 and S/G2 phases of their cell cycles. Results are mean ± SE (n = 6). The differences between the G0/G1 and S/G2 phase cells were statistically significant (shown by '*'; p < 0.001).
Figure 2
Figure 2
The transcription start sites of the reverse transcript from BRCA2 gene bi-directional promoter. (A) GeneRacer amplification product for ZAR2. See Materials and methods for details. (B) Nucleotide sequence of human ZAR2/BRCA2 bi-directional promoter. The transcriptional start sites (TSSs), as determined by GeneRacer technique, are shown. The segment in green color is the sequence complementary to part of the intron 1 sequence of human BRCA2 gene, the segment in red color is from exon 1 and the blue part is from the upstream sequence of BRCA2 gene. The E-box sequence essential for BRCA2 gene expression [18,19] is underlined. The splice donor site at the ZAR2 gene exon 1/intron 1 junction is indicated by a downward arrow. The 'G' residue at the SNP site at -26 from BRCA2 gene transcription start site is shown by a red *. (C) Cartoon showing the human BRCA2 (upper panel) and ZAR2 (lower panel) gene promoter studied. The identities of ZAR2 exon1 (Ex-1) and intron 1 (Int-1) were experimentally determined in this study. TSS: transcription start site (designated as +1); URS: upstream regulatory sequence.
Figure 3
Figure 3
Conservation of the BRCA2/ZAR2 genetic arrangements in vertebrates. (A) Relative chromosomal locations of BRCA2 and ZAR2 genes in different vertebrates. The maps were obtained from NCBI site for Entrez genes http://www.ncbi.nlm.nih.gov/sites/entrez?db=gene&term=BRCA2+ Not drawn to the scale. (B) Dendrogram with branch lengths for the ZAR2 proteins from different vertebrates. The putative ZAR2 protein amino acid sequences were mined from the NCBI Entrez database and dendrogram with branch length was analyzed by CLUSTALW program http://align.genome.jp/.
Figure 4
Figure 4
The exon-intron structure and mRNA sequence of human ZAR2 gene. (A) Cartoon showing the exon-intron structure of human ZAR2 gene. The first exon of ZAR2 overlaps with the exon 1 of the BRCA2 gene (not drawn to the scale). (B) Nucleotide sequence of human ZAR2 mature mRNA. The 5'-UTR sequence was experimentally determined (see text for details). The putative protein coding sequence (ORF) is shown in blue and highlighted in gray. The upstream AUG (uAUG) codons at the 5'-UTR are highlighted: out-of-frame uAUGs are in yellow shades; in-frame uAUGs are in green shades. The 5'-UTR sequence overlapping with BRCA2 mRNA sequences are shaded yellow. Rest of the 5'-UTR sequence of ZAR2 mRNA is derived from the newly identified exon 1 and is shown in red.
Figure 5
Figure 5
Analysis of ZAR2 protein sequence. (A) Amino acid sequence of human ZAR2 protein showing the C4 type zinc fingers. Cys residues of the zinc fingers are underscored and putative nuclear localization signals are highlighted. (B) CLUSTALW alignment between human ZAR1 (NP_783318) and ZAR2 (NP_001130043) amino acid sequences. hZar1: human ZAR1; hZar2: human ZAR2. Identical amino acid residues are highlighted in grey and the similar amino acid residues are shown in yellow shades. The conserved C4-type zinc fingers #1 and #2 are also shown.
Figure 6
Figure 6
CLUSTALW alignment of ZAR2 amino acid sequences from different vertebrates. hZar2: human (Homo sapiens) ZAR2 (NP_001130043); cZar2: canine (Canis familiaris) ZAR2 (XP_534509); gZar2: chicken (Gallus gallus) ZAR2 (XP_001233594); mZar2: mouse (Mus musculus) ZAR2 (NP_001153165); rZar2: Rat (Rattus norvegicus) ZAR2 (XP_001071298). Identical amino acid residues are highlighted in grey and the similar amino acid residues are shown in yellow shades. The conserved C4-type zinc fingers #1 and #2 are also shown.
Figure 7
Figure 7
Over expression of ZAR2 protein and its subcellular location in MCF7 and MDA-MB-231 cells. (A) RT-PCR analysis showing the expression of N-terminal (i) and C-terminal (ii) FLAG-tagged ZAR2 mRNA in MCF7 cells. ZAR2-1 and ZAR2-2 are two independently derived transfectants. Similar results were obtained with MDA-MB-231 cells. (B) Western blotting analysis with anti-FLAG antibody showing expression of N-terminal (i) and C-terminal (ii) FLAG-tagged ZAR2 protein in MCF7 cells. Similar results were obtained with MDA-MB-231 cells. (C) Immunofluorescence analysis showing predominantly cytosolic location of N-terminal FLAG-tagged ZAR2 protein in the dividing MDA-MB-231 cells (left panel); and the C-terminal FLAG-tagged ZAR2 in dividing MCF7 cells (right panel). Anti-FLAG M2 antibody was used for the detection of FLAG-tagged ZAR2 protein in the cells. The cells were transiently transfected with the expression plasmid constructs and thus not all cells are expressing the recombinant protein. (D) Immunofluorescence confocal microscopy after dual labeling of the unsynchronized C-terminal FLAG-tagged ZAR2-expressing MCF7 cells with reagents for FLAG-ZAR2 (red) and the S-phase marker cyclin A (green). Predominant levels of FLAG-ZAR2 in the cytosol of the cells that have high levels of cyclin A in the nucleus. Nucleus was stained with Topro for confocal microscopy.
Figure 8
Figure 8
Relative expressions of BRCA2 and ZAR2 mRNAs at different cell cycle stages of human breast cells. (A) RT-PCR analysis showing the expressions of BRCA2 and ZAR2 mRNAs in the unsynchronized (mostly dividing) cells. β-Actin mRNA was used as a loading control. (B) Real-time RT-PCR evaluation of the relative levels of BRCA2 and ZAR2 mRNAs in different human breast cancer cells at G0/G1 and S/G2 phases. The differences between the G0/G1 and S/G2 phase cells were statistically significant (shown by '*'; p < 0.001). (C) Immunofluorescence confocal microscopy showing growth phase-dependent localization of N-terminal FLAG-tagged ZAR2 protein in the synchronized MCF7 cells. Anti-FLAG M2 antibody was used for the detection of FLAG-tagged ZAR2 protein in the cells. The cells were transiently transfected with the expression plasmid constructs and thus not all cells are expressing the recombinant protein.
Figure 9
Figure 9
In vivo binding of ZAR2 protein to the BRCA2/ZAR2 gene promoter. (A) PCR amplification of the immunoprecipitated chromatin DNA fragment pulled down with FLAG antibody from synchronized MCF7 cells over-expressing C-terminal FLAG-tagged ZAR2 protein at the G0/G1 and S/G2 phases. Input DNA (5% was used as control. Chromatin DNA fragments mock precipitated with mouse IgG did not significantly amplified any detectable DNA. BRCA2 gene promoter specific primers [21] were used for PCR amplifications. (B) Quantitative ChIP analysis of ZAR2 recruitment to BRCA2/ZAR2 bi-directional promoter in MCF7 cells at G0/G1 and S/G2 phases. qChIP-PCR analyses were performed with chromatin extracts harvested from cells over expressing C-terminal FLAG-tagged ZAR2. The mean values from triplicate data points are plotted and error bars indicate ± SE. The amplification values are normalized by subtraction with IgG control antibody and then division with 1% input DNA. Data shown were representative of three independent experiments (mean + SE) and the difference between the G0/G1 phase and the S/G2 phase cells was statistically significant (shown by '*'; p < 0.001).
Figure 10
Figure 10
Effects of over-expression (OVEX) of the C-terminal FLAG-tagged ZAR2 in synchronized MCF7 cells on the BRCA2 and ZAR2 mRNA levels (A) and on the activities of BRCA2 and ZAR2 gene promoters (B) at the S/G2 phase. MCF7 cells were stably transfected with C-terminally FLAG-tagged ZAR2 and evaluated for their ZAR2 over expression. Levels of the mRNAs were determined by real-time RT-PCR [21]. Promoter activities were measured in MCF7 cells transiently transfected with the single-reporter constructs (Fig. 1B) following the dual luciferase assay protocols (Promega). pGL3-Control was used as normalization control as described in the 'Methods' section. Results are mean ± SE (n = 6). '*' indicates the difference between the corresponding control and the experimental sets is statistically significant (p < 0.001).
Figure 11
Figure 11
Effect of knockdown of ZAR2 in synchronized MCF7 cells on the BRCA2 and ZAR2 mRNA levels (A) and on the activities of BRCA2 and ZAR2 gene promoters (B) at the G0/G1 phase. ZAR2 was knocked down in MCF7 cells with two different double-stranded stealth siRNAs (Invitrogen). Levels of the mRNAs were determined by real-time RT-PCR. Promoter activities were measured in MCF7 cells transiently transfected with the single-reporter constructs (Fig. 1B) following the dual luciferase assay protocols (Promega). pGL3-Control was used as normalization control as described in the 'Methods' section. Results are mean ± SE (n = 6). '*' indicates the difference between the corresponding control and the experimental sets is statistically significant (p < 0.001).

Similar articles

Cited by

References

    1. Palacios J, Robles-Frías MJ, Castilla MA, López-García MA, Benítez J. The molecular pathology of hereditary breast cancer. Pathobiology. 2008;75:85–94. doi: 10.1159/000123846. - DOI - PubMed
    1. Olopade OI, Grushko TA, Nanda R, Huo D. Advances in breast cancer: pathways to personalized medicine. Clin Cancer Res. 2008;14:7988–7999. doi: 10.1158/1078-0432.CCR-08-1211. - DOI - PMC - PubMed
    1. Campeau PM, Foulkes WD, Tischkowitz MD. Hereditary breast cancer: new genetic developments, new therapeutic avenues. Hum Genet. 2008;124:31–42. doi: 10.1007/s00439-008-0529-1. - DOI - PubMed
    1. Venkitaraman AR. Linking the cellular functions of BRCA genes to cancer pathogenesis and treatment. Annu Rev Pathol. 2009;4:461–87. doi: 10.1146/annurev.pathol.3.121806.151422. - DOI - PubMed
    1. Agalliu I, Kwon EM, Zadory D, McIntosh L, Thompson J, Stanford JL, Ostrander EA. Germline mutations in the BRCA2 gene and susceptibility to hereditary prostate cancer. Clin Cancer Res. 2007;13:839–843. doi: 10.1158/1078-0432.CCR-06-2164. - DOI - PubMed

Publication types

MeSH terms