

Structure-function correlations using scanning laser polarimetry in primary angle-closure glaucoma and primary open-angle glaucoma
- PMID: 20202618
- PMCID: PMC2866157
- DOI: 10.1016/j.ajo.2009.12.007
Structure-function correlations using scanning laser polarimetry in primary angle-closure glaucoma and primary open-angle glaucoma
Abstract
Purpose: To assess the correlations between retinal nerve fiber layer (RNFL) thickness measured with scanning laser polarimetry and visual field (VF) sensitivity in primary open-angle glaucoma (POAG) and primary angle-closure glaucoma (PACG).
Design: Prospective, comparative, observational cases series.
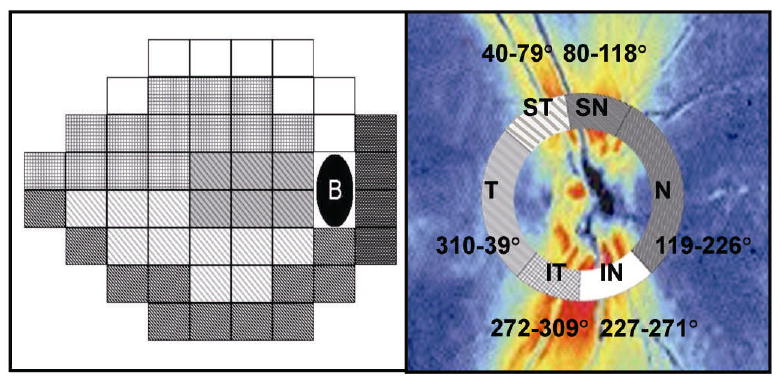
Methods: Fifty patients with POAG and 56 patients with PACG were examined using scanning laser polarimetry with variable corneal compensation (GDx VCC; Laser Diagnostic Technologies, Inc.) and Humphrey VF analyzer (Carl Zeiss Meditec, Inc.) between August 2005 and July 2006 at Taipei Veterans General Hospital. Correlations between RNFL thickness and VF sensitivity, expressed as mean sensitivity in both decibel and 1/Lambert scales, were estimated by the Spearman rank correlation coefficient (r(s)) and multivariate median regression models (pseudo R(2)). The correlations were determined globally and for 6 RNFL sectors and their corresponding VF regions.
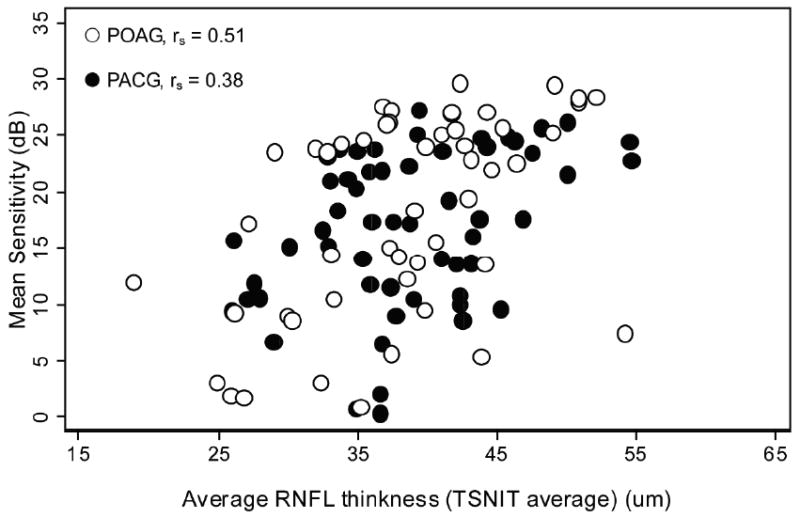
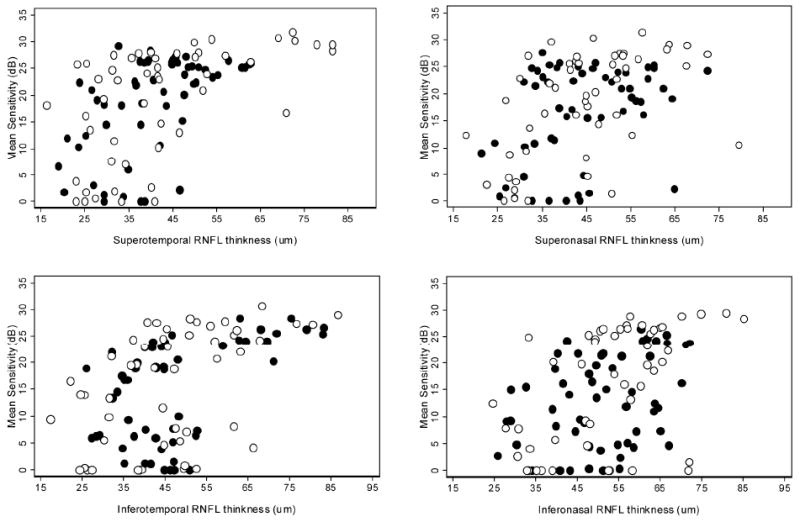
Results: The correlation between RNFL thickness and mean sensitivity (in decibels) was weaker in the PACG group (r(s) = 0.38; P = .004; pseudo R(2) = 0.17) than in the POAG group (r(s) = 0.51; P < .001; pseudo R(2) = .31), but the difference in the magnitude of correlation was not significant (P = .42). With Bonferroni correction, the structure-function correlation was significant in the superotemporal (r(s) = 0.62), superonasal (r(s) = 0.56), inferonasal (r(s) = 0.53), and inferotemporal (r(s) = 0.50) sectors in the POAG group (all P < .001), whereas it was significant only in the superotemporal (r(s) = 0.53) and inferotemporal (r(s) = 0.48) sectors in the PACG group (both P < .001). The results were similar when mean sensitivity was expressed as 1/Lambert scale.
Conclusions: Both POAG and PACG eyes had moderate structure-function correlations using scanning laser polarimetry. Compared with eyes with POAG, fewer RNFL sectors have significant structure-function correlations in eyes with PACG.
Copyright 2010 Elsevier Inc. All rights reserved.
Figures
Similar articles
-
Structure-function relationships using confocal scanning laser ophthalmoscopy, optical coherence tomography, and scanning laser polarimetry.Invest Ophthalmol Vis Sci. 2006 Jul;47(7):2889-95. doi: 10.1167/iovs.05-1489. Invest Ophthalmol Vis Sci. 2006. PMID: 16799030
-
Comparing glaucomatous optic neuropathy in primary open angle and primary angle closure glaucoma eyes by scanning laser polarimetry-variable corneal compensation.J Glaucoma. 2008 Mar;17(2):105-10. doi: 10.1097/IJG.0b013e31814b9971. J Glaucoma. 2008. PMID: 18344755
-
Scanning laser polarimetry with variable corneal compensation in primary angle-closure glaucoma.Ophthalmology. 2008 Aug;115(8):1334-9. doi: 10.1016/j.ophtha.2007.10.042. Epub 2008 Jan 16. Ophthalmology. 2008. PMID: 18201763
-
The Relationship Between Peripapillary Vascular Density and Visual Field Sensitivity in Primary Open-Angle and Angle-Closure Glaucoma.Invest Ophthalmol Vis Sci. 2018 Dec 3;59(15):5862-5867. doi: 10.1167/iovs.18-25423. Invest Ophthalmol Vis Sci. 2018. PMID: 30550617
-
Structure-function relationship is stronger with enhanced corneal compensation than with variable corneal compensation in scanning laser polarimetry.Invest Ophthalmol Vis Sci. 2007 Apr;48(4):1651-8. doi: 10.1167/iovs.06-1003. Invest Ophthalmol Vis Sci. 2007. PMID: 17389496
Cited by
-
Differences and Similarities Between Primary Open Angle Glaucoma and Primary Angle-Closure Glaucoma.Eye Brain. 2024 Sep 17;16:39-54. doi: 10.2147/EB.S472920. eCollection 2024. Eye Brain. 2024. PMID: 39309574 Free PMC article. Review.
-
Intrinsic Functional Connectivity Alterations of the Primary Visual Cortex in Primary Angle-Closure Glaucoma Patients before and after Surgery: A Resting-State fMRI Study.PLoS One. 2017 Jan 25;12(1):e0170598. doi: 10.1371/journal.pone.0170598. eCollection 2017. PLoS One. 2017. PMID: 28122025 Free PMC article.
-
Use of microperimetry to compare macular light sensitivity in eyes with open-angle and angle-closure glaucoma.Jpn J Ophthalmol. 2012 Mar;56(2):138-44. doi: 10.1007/s10384-011-0111-6. Epub 2011 Dec 10. Jpn J Ophthalmol. 2012. PMID: 22160406
-
Structure-Function Relationship in Glaucoma Patients With Parafoveal Versus Peripheral Nasal Scotoma.Invest Ophthalmol Vis Sci. 2016 Feb;57(2):420-8. doi: 10.1167/iovs.15-18256. Invest Ophthalmol Vis Sci. 2016. PMID: 26848881 Free PMC article.
-
A survey on computer aided diagnosis for ocular diseases.BMC Med Inform Decis Mak. 2014 Aug 31;14:80. doi: 10.1186/1472-6947-14-80. BMC Med Inform Decis Mak. 2014. PMID: 25175552 Free PMC article. Review.
References
-
- Quigley HA, Katz J, Derick RJ, et al. An evaluation of optic disc and nerve fiber layer examinations in monitoring progression of early glaucoma damage. Ophthalmology. 1992;99(1):19–28. - PubMed
-
- Reus NJ, Lemij HG. The Relationship between Standard Automated Perimetry and GDx VCC Measurements. Invest Ophthalmol Vis Sci. 2004;45(3):840–5. - PubMed
-
- Schlottmann PG, De Cilla S, Greenfield DS, et al. Relationship between Visual Field Sensitivity and Retinal Nerve Fiber Layer Thickness as Measured by Scanning Laser Polarimetry. Invest Ophthalmol Vis Sci. 2004;45(6):1823–9. - PubMed
-
- Reus NJ, Lemij HG. Relationships between standard automated perimetry, HRT confocal scanning laser ophthalmoscopy, and GDx VCC scanning laser polarimetry. Invest Ophthalmol Vis Sci. 2005;46(11):4182–8. - PubMed
-
- Leung CKs, Chong KKL, Chan Wm, et al. Comparative Study of Retinal Nerve Fiber Layer Measurement by StratusOCT and GDx VCC, II: Structure/Function Regression Analysis in Glaucoma. Invest Ophthalmol Vis Sci. 2005;46(10):3702–11. - PubMed
Publication types
MeSH terms
Grants and funding
LinkOut - more resources
Full Text Sources
