

Self-association of Zn-insulin at neutral pH: investigation by concentration gradient--static and dynamic light scattering
- PMID: 20202736
- PMCID: PMC2867077
- DOI: 10.1016/j.bpc.2010.02.001
Self-association of Zn-insulin at neutral pH: investigation by concentration gradient--static and dynamic light scattering
Abstract
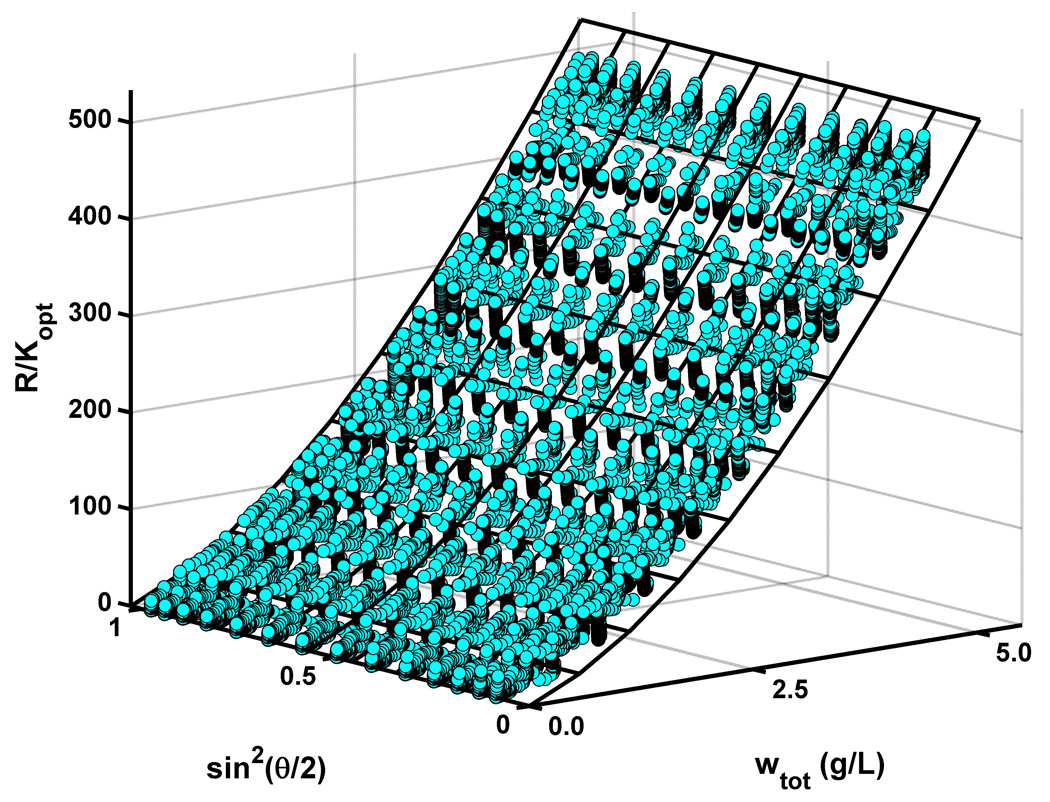
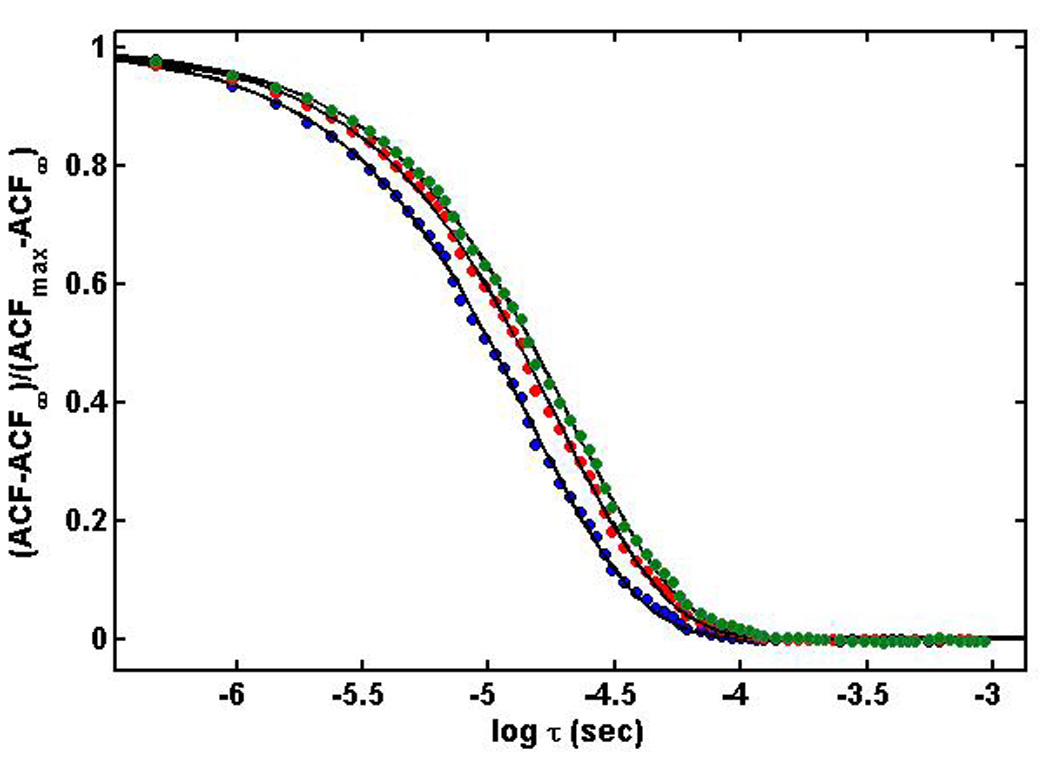
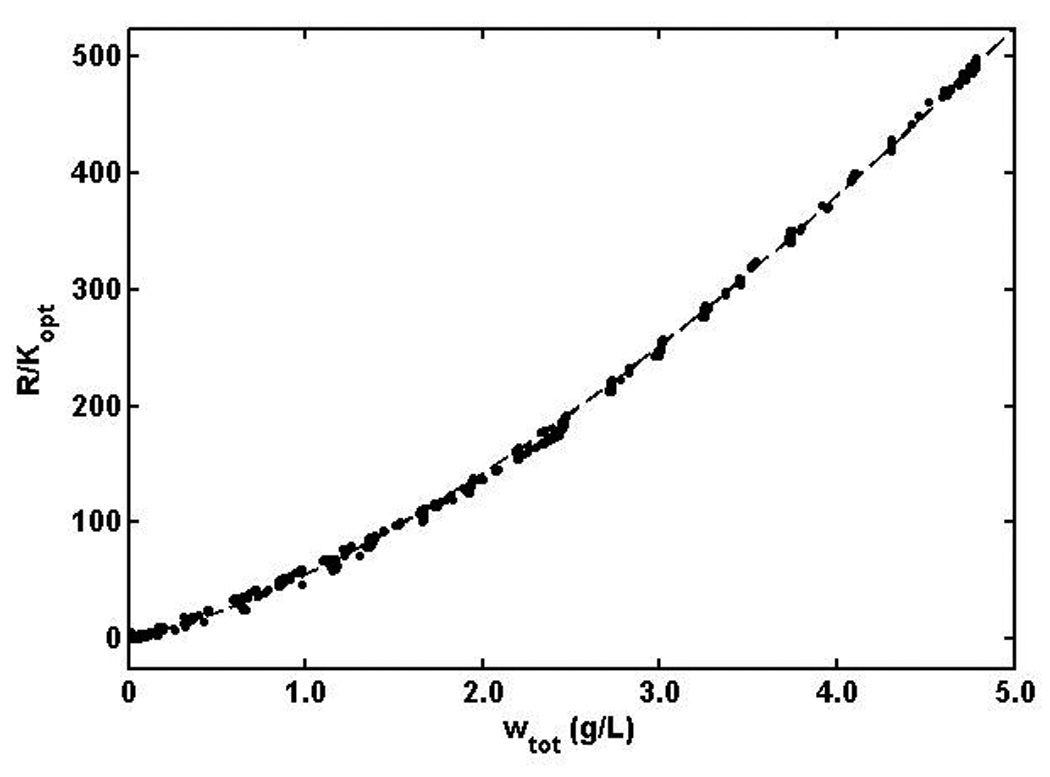
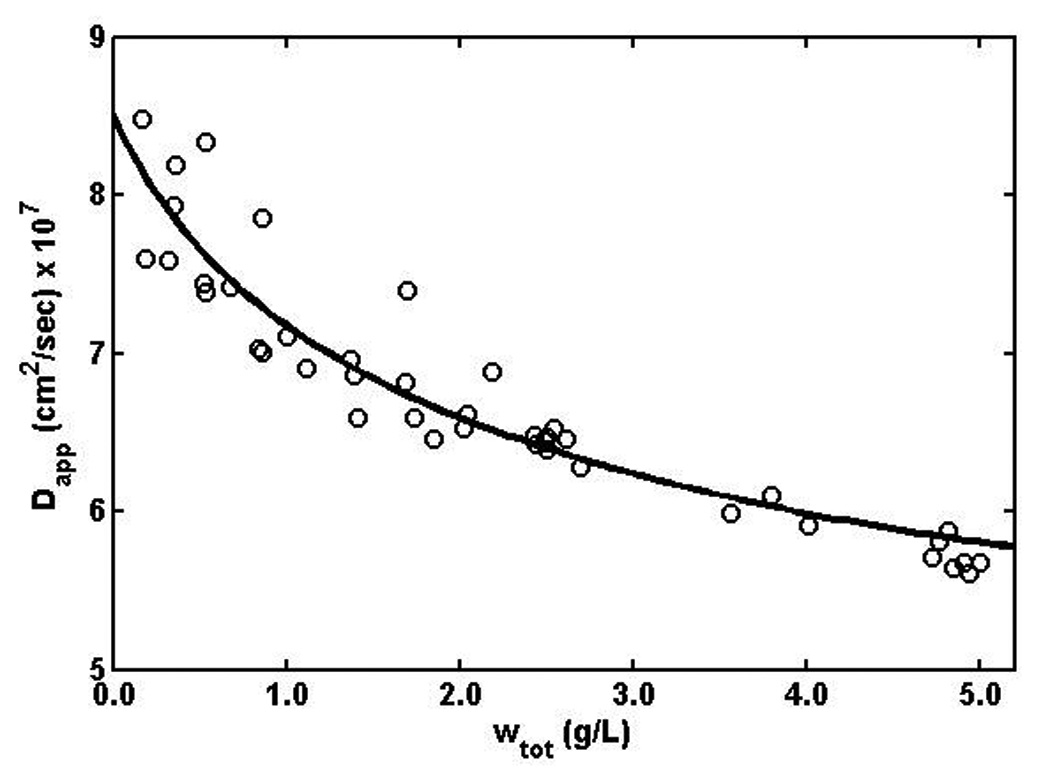
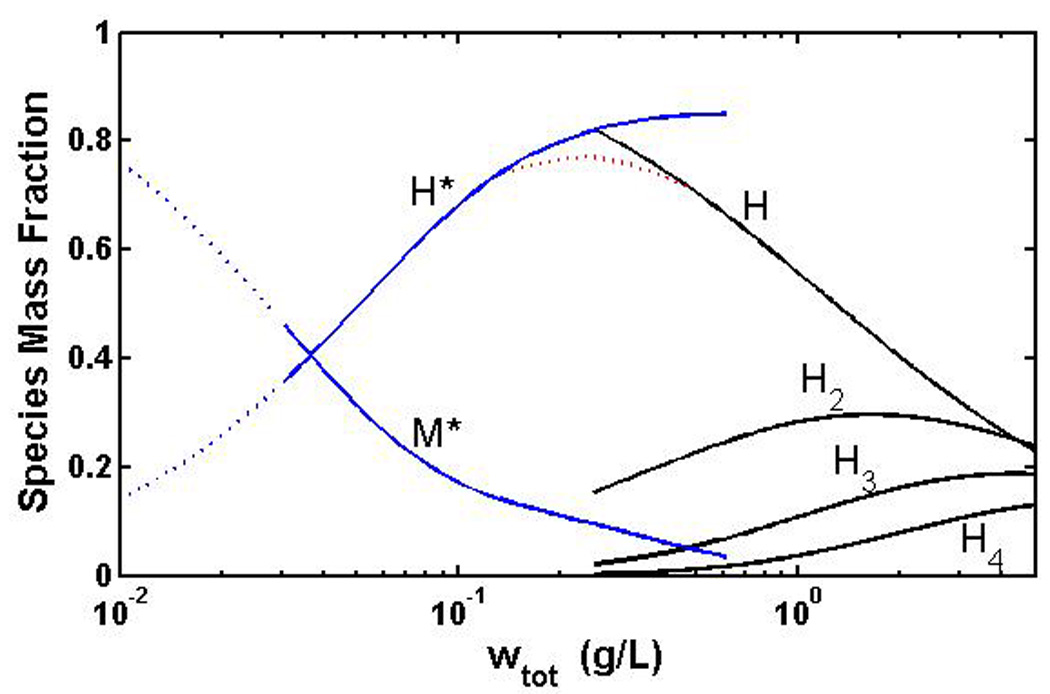
Equilibrium self-association of Zn-insulin at pH 7.0 was characterized over the range 0.3-5mg/mL by simultaneous measurement of static and dynamic light scattering. Analysis of static light scattering yielded a concentration-dependent weight-average molecular weight, and analysis of dynamic light scattering yielded a concentration-dependent intensity-average diffusion coefficient. The concentration dependence of both quantities may be accounted for to within experimental precision by a simple model, according to which the basic structural unit of Zn-insulin at concentrations exceeding 0.3mg/mL is a hexamer H. With increasing total protein concentration, hexameric protomers may self-associate in accordance with an isodesmic scheme in which a protomer may add to any prexisting oligomer H(n) to form H(n+1) with an invariant stepwise equilibrium association constant.
Figures
Similar articles
-
pH-dependent self-association of zinc-free insulin characterized by concentration-gradient static light scattering.Biophys Chem. 2010 May;148(1-3):28-33. doi: 10.1016/j.bpc.2010.02.002. Epub 2010 Feb 8. Biophys Chem. 2010. PMID: 20202737 Free PMC article.
-
The influence of ionic strength and pH on the aggregation properties of zinc-free insulin studied by static and dynamic laser light scattering.Biopolymers. 1993 Nov;33(11):1643-57. doi: 10.1002/bip.360331103. Biopolymers. 1993. PMID: 8241425
-
Light scattering coupled with reversed phase chromatography to study protein self-association under separating conditions.J Chromatogr B Analyt Technol Biomed Life Sci. 2013 Nov 1;938:60-4. doi: 10.1016/j.jchromb.2013.08.031. Epub 2013 Aug 30. J Chromatogr B Analyt Technol Biomed Life Sci. 2013. PMID: 24055751
-
Insulin association in neutral solutions studied by light scattering.Biophys Chem. 1991 Feb;39(2):205-13. doi: 10.1016/0301-4622(91)85023-j. Biophys Chem. 1991. PMID: 17014767
-
Zinc-ligand interactions modulate assembly and stability of the insulin hexamer -- a review.Biometals. 2005 Aug;18(4):295-303. doi: 10.1007/s10534-005-3685-y. Biometals. 2005. PMID: 16158220 Review.
Cited by
-
Stable Monomeric Insulin Formulations Enabled by Supramolecular PEGylation of Insulin Analogues.Adv Ther (Weinh). 2020 Jan;3(1):1900094. doi: 10.1002/adtp.201900094. Epub 2019 Dec 17. Adv Ther (Weinh). 2020. PMID: 32190729 Free PMC article.
-
Recent applications of light scattering measurement in the biological and biopharmaceutical sciences.Anal Biochem. 2016 May 15;501:4-22. doi: 10.1016/j.ab.2016.02.007. Epub 2016 Feb 17. Anal Biochem. 2016. PMID: 26896682 Free PMC article. Review. No abstract available.
-
Novel covalently linked insulin dimer engineered to investigate the function of insulin dimerization.PLoS One. 2012;7(2):e30882. doi: 10.1371/journal.pone.0030882. Epub 2012 Feb 17. PLoS One. 2012. PMID: 22363506 Free PMC article.
-
The Possible Role of the Type I Chaperonins in Human Insulin Self-Association.Life (Basel). 2022 Mar 18;12(3):448. doi: 10.3390/life12030448. Life (Basel). 2022. PMID: 35330199 Free PMC article.
-
Poly(trehalose methacrylate) as an Excipient for Insulin Stabilization: Mechanism and Safety.ACS Appl Mater Interfaces. 2022 Aug 24;14(33):37410-37423. doi: 10.1021/acsami.2c09301. Epub 2022 Aug 14. ACS Appl Mater Interfaces. 2022. PMID: 35968684 Free PMC article.
References
-
- Dunn MF. Zinc-ligand interactions modulate assembly and stability of the insulin hexamer - a review. Biometals. 2005;18:295–303. - PubMed
-
- Vallee BL, Gibson JG., 2nd The zinc content of normal human whole blood, plasma, leucocytes, and erythrocytes. J Biol Chem. 1948;176:445–457. - PubMed
-
- Milthorpe BK, Nichol LW, Jeffrey PD. The polymerization pattern of zinc(II)-insulin at pH 7.0. Biochim. Biophys. Acta. 1977;495:195–202. - PubMed
-
- Attri AK, Minton AP. New methods for measuring macromolecular interactions in solution via static light scattering: basic methodology and application to nonassociating and self-associating proteins. Anal. Biochem. 2005;337:103–110. - PubMed
-
- Attri AK, Minton AP. Composition gradient static light scattering: a new technique for rapid detection and quantitative characterization of reversible macromolecular hetero-associations in solution. Anal. Biochem. 2005;346:132–138. - PubMed
Publication types
MeSH terms
Substances
Grants and funding
LinkOut - more resources
Full Text Sources
Other Literature Sources
Medical
