

pH-dependent self-association of zinc-free insulin characterized by concentration-gradient static light scattering
- PMID: 20202737
- PMCID: PMC2856799
- DOI: 10.1016/j.bpc.2010.02.002
pH-dependent self-association of zinc-free insulin characterized by concentration-gradient static light scattering
Abstract
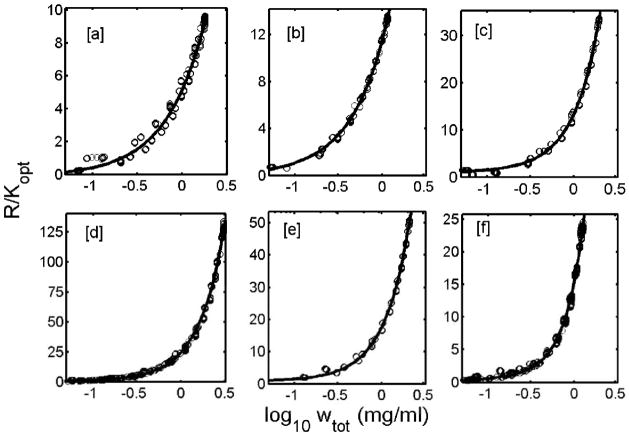
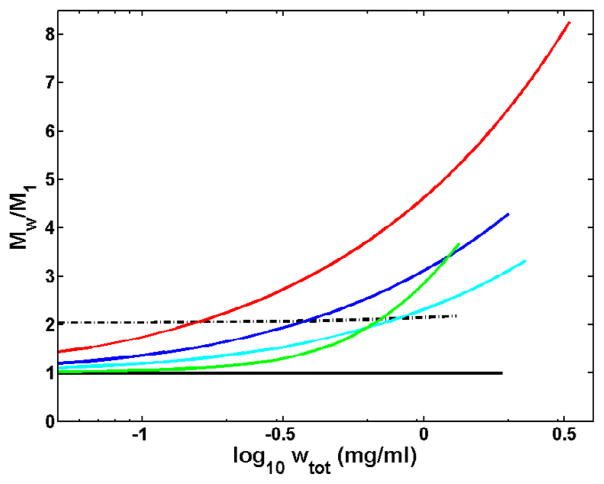
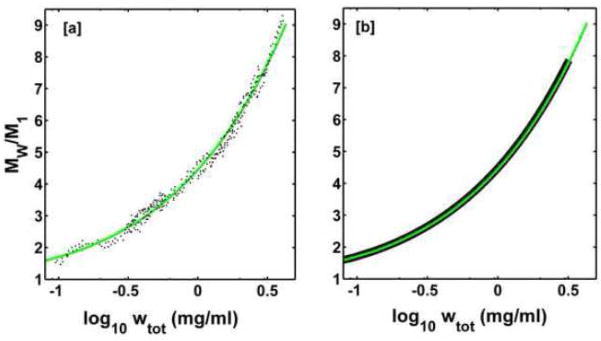
Insulin self-association at pH 1.85, 1.95, 3.0, 7.2, 8.0 and 10 was studied via composition gradient light scattering (CG-SLS). At pH 1.95 in acetic acid, insulin was found to exist as a monomer, and in pH 1.85 HCl as a dimer. At pH values of 3.0-8.0, the dependence of scattering intensity upon total insulin concentration at concentrations of up to 1.5mg/mL may be quantitatively accounted for by a simple isodesmic association equilibrium scheme requiring only a single association constant for addition of monomer to monomer or any oligomer. At pH 10, the association constant for addition of monomer to monomer was found to be smaller than the association constant for addition of monomer to all higher oligomers by a factor of approximately five. The isodesmic association scheme was also found to quantitatively account for the concentration dependence of the weight-average molecular weight derived from previously published sedimentation equilibrium measurements made at pH 7.0, and the best-fit value of the stepwise equilibrium constant obtained therefrom was in excellent agreement with that obtained from analysis of the light scattering data obtained at pH 7.2.
Figures
References
-
- Pekar AH, Frank BH. Conformation of proinsulin. A comparison of insulin and proinsulin self-association at neutral pH. Biochemistry. 1972;11:4013–4016. - PubMed
-
- Jeffrey PD, Coates JH. An equilibrium ultracentrifugation study of the effect of ionic strength on the self-association of bovine insulin. Biochemistry. 1966;5:3820–3824. - PubMed
-
- Mark AE, Nichol LW, Jeffrey PD. The self-association of zinc-free bovine insulin. A single model based on interactions in the crystal that describes the association pattern in solution at pH 2, 7 and 10. Biophys Chem. 1987;27:103–117. - PubMed
-
- Jeffrey PD, Milthorpe BK, Nichol LW. Polymerization pattern of insulin at pH 7.0. Biochemistry. 1976;15:4660–4665. - PubMed
Publication types
MeSH terms
Substances
Grants and funding
LinkOut - more resources
Full Text Sources
Other Literature Sources
Medical
