

Statistical expression deconvolution from mixed tissue samples
- PMID: 20202973
- PMCID: PMC2853690
- DOI: 10.1093/bioinformatics/btq097
Statistical expression deconvolution from mixed tissue samples
Abstract
Motivation: Global expression patterns within cells are used for purposes ranging from the identification of disease biomarkers to basic understanding of cellular processes. Unfortunately, tissue samples used in cancer studies are usually composed of multiple cell types and the non-cancerous portions can significantly affect expression profiles. This severely limits the conclusions that can be made about the specificity of gene expression in the cell-type of interest. However, statistical analysis can be used to identify differentially expressed genes that are related to the biological question being studied.
Results: We propose a statistical approach to expression deconvolution from mixed tissue samples in which the proportion of each component cell type is unknown. Our method estimates the proportion of each component in a mixed tissue sample; this estimate can be used to provide estimates of gene expression from each component. We demonstrate our technique on xenograft samples from breast cancer research and publicly available experimental datasets found in the National Center for Biotechnology Information Gene Expression Omnibus repository.
Availability: R code (http://www.r-project.org/) for estimating sample proportions is freely available to non-commercial users and available at http://www.med.miami.edu/medicine/x2691.xml.
Figures
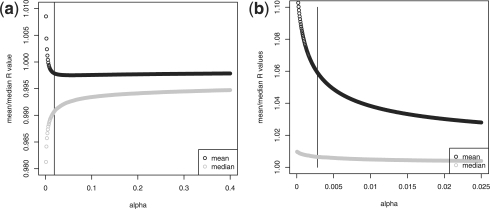
 and md(tR(α)) as functions of α for (a) MDA231/mouse titration data at pA=0.5 and (b) MAQC human titration data at pA=0.75. The vertical line indicates the correct value of α.
References
-
- Affymetrix Inc. Affymetrix Expression Console Software Version 1.0 — User Guide. Santa Clara, CA: 2009.
-
- Ames W. Numerical Methods for Partial Differential Equations. New York: Academic Press; 1977.
-
- Canty A, et al. Bootstrap diagnostics and remedies. Can. J. Stat. 2002;34:5–27.
-
- Causton H, et al. Microarray gene expression data analysis: A beginner's guide. Malden, MA: Blackwell Science; 2003.
Publication types
MeSH terms
Grants and funding
LinkOut - more resources
Full Text Sources
Other Literature Sources
