. 2010 Jul;38(12):3891-908.
doi: 10.1093/nar/gkq115. Epub 2010 Mar 4.

The impact of intragenic CpG content on gene expression

Affiliations

The impact of intragenic CpG content on gene expression

Asli Petra Bauer et al. Nucleic Acids Res. 2010 Jul.

Abstract

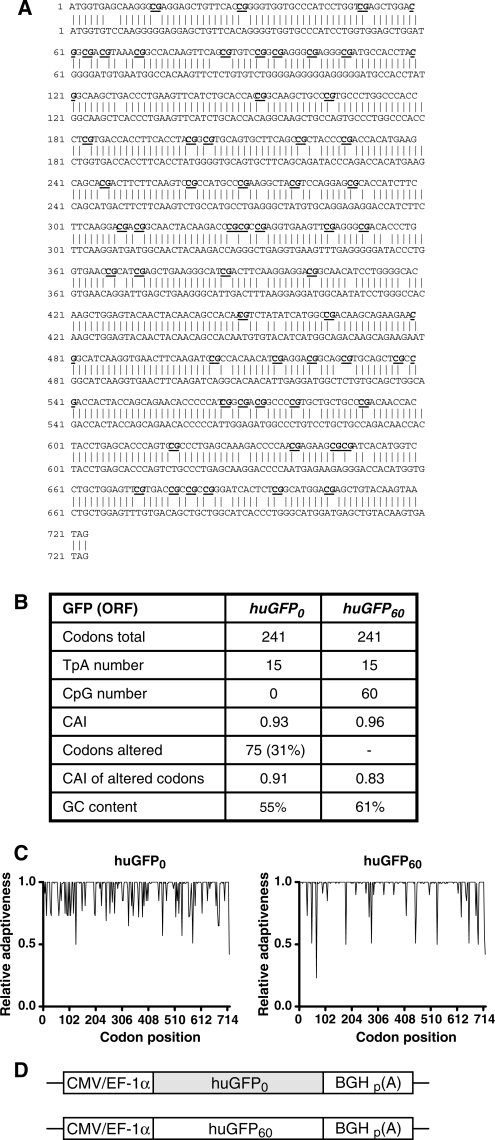
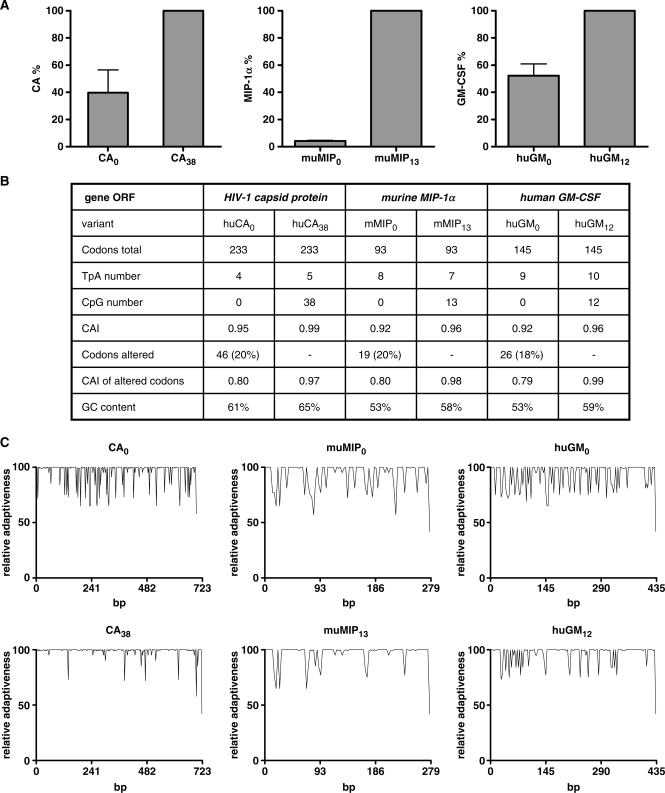
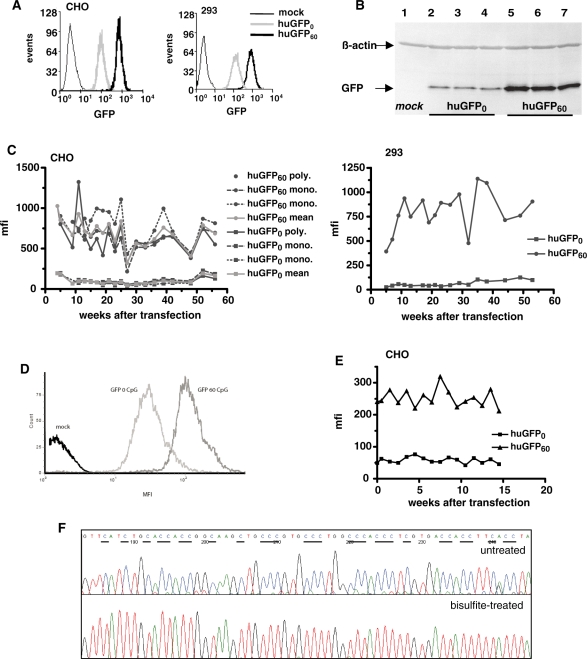
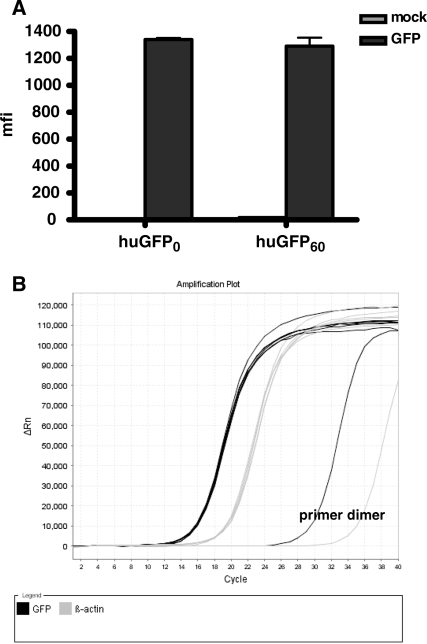
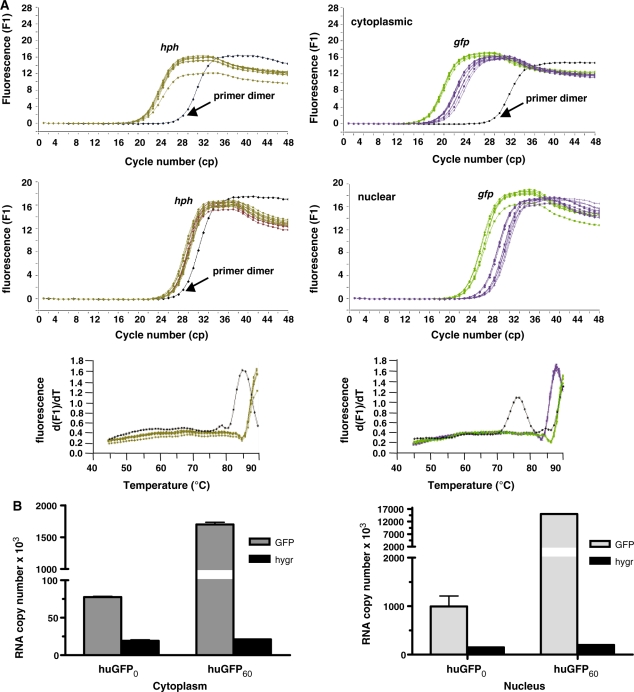
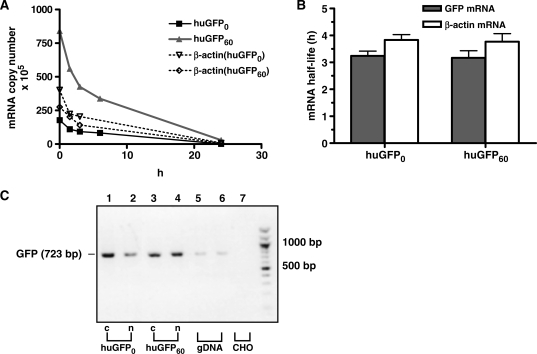
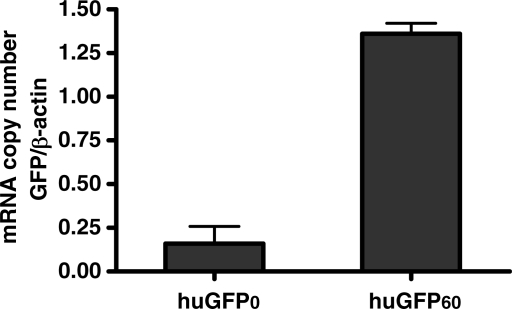
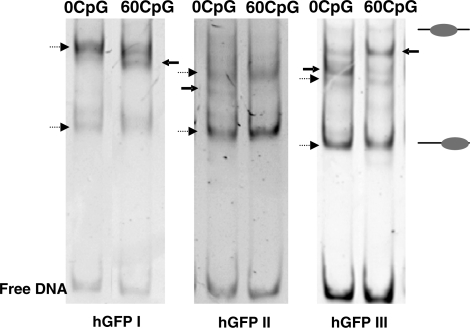
The development of vaccine components or recombinant therapeutics critically depends on sustained expression of the corresponding transgene. This study aimed to determine the contribution of intragenic CpG content to expression efficiency in transiently and stably transfected mammalian cells. Based upon a humanized version of green fluorescent protein (GFP) containing 60 CpGs within its coding sequence, a CpG-depleted variant of the GFP reporter was established by carefully modulating the codon usage. Interestingly, GFP reporter activity and detectable protein amounts in stably transfected CHO and 293 cells were significantly decreased upon CpG depletion and independent from promoter usage (CMV, EF1 alpha). The reduction in protein expression associated with CpG depletion was likewise observed for other unrelated reporter genes and was clearly reflected by a decline in mRNA copy numbers rather than translational efficiency. Moreover, decreased mRNA levels were neither due to nuclear export restrictions nor alternative splicing or mRNA instability. Rather, the intragenic CpG content influenced de novo transcriptional activity thus implying a common transcription-based mechanism of gene regulation via CpGs. Increased high CpG transcription correlated with changed nucleosomal positions in vitro albeit histone density at the two genes did not change in vivo as monitored by ChIP.


Figures

Figure 1.
Figure 1.
Comparison of the codon-optimized huGFP reporter genes.(A) Nucleic acid sequence alignment of the unmodified (upper sequence) and CpG-depleted (lower sequence) humanized GFP genes. Sequences were aligned using the DNAman software and exhibit 88% homology. (B) Comparison of sequence-specific parameters. CpG: CpG dinucleotide; CAI: codon adaption index; GC content: percentage of bases C and G within the overall sequence; TpA: TpA dinucleotide. (C) Relative Adaptiveness distribution of the two gfp gene variants. The Relative Adaptiveness reflects the frequency of individual codons, whereas the most frequently used triplet encoding a given amino acid is set to 1.0 and less frequently used codons are scaled down accordingly. (D) In the pc5 vector, huGFP0 and huGFP60 sequences are flanked by the CMV or EF-1α promoter region respectively (CMV/EF-1α) and the BGH poly-adenylation signal (p(A)).
Figure 2.
Figure 2.
Influence of intragenic and plasmid backbone CpG content on transient GFP expression in eukaryotic cells. H1299 cells were transiently transfected (A) with 15 μg of the eukaryotic expression vectors pc5 or pc3.1100 carrying the huGFP0 or huGFP60 reporter genes or (C) with pc3.1100 and pc3.147-based reporter constructs. Cells were harvested 48-h posttransfection and subjected to FACS analysis counting 10 000 events per gate. An exemplary FACS analysis of cells transfected with pcDNA3.1 (mock) or huGFP0 and huGFP60 in pc3.1100 is shown for evaluation of transfection efficiencies (B). The average mfi is indicated as percentage of huGFP60 derived fluorescence (A) or as percentage of pc3.1100-mediated GFP expression (C), respectively. The mean of three independent transfection experiments is given, and standard deviations are indicated.
Figure 3.
Figure 3.
Influence of intragenic CpG depletion on transient expression of viral and cytokine reporter genes. (A) H1299 cells were transiently transfected with 15 μg of the indicated constructs in pcDNA3.1. Forty-eight-hours posttransfection, normalized cell lysates (CA) and supernatants (muMIP and huGM) were screened for protein content by ELISA as described in materials and methods. Protein amounts obtained from transfections with the CpG-rich genes were set to 100%, and values for the CpG lacking variants were related accordingly. The mean of four independent transfection experiments is shown, and standard deviations are indicated. (B) Comparison of sequence-specific parameters. CpG: CpG dinucleotide; CAI: codon adaption index; GC content: percentage of bases C and G within the overall sequence; TpA: TpA dinucleotide. (C) Relative Adaptiveness distribution of the CA, muMIP and huGM gene variants. The Relative Adaptiveness reflects the frequency of individual codons, whereas the most frequently used triplet encoding a given amino acid is set to 1.0 and less frequently used codons are scaled down accordingly.
Figure 4.
Figure 4.
Influence of intragenic CpG content on long-term stable GFP expression in mammalian cells. (A) CHO (left) and 293 cells (right) stably expressing huGFP0 or huGFP60 were subjected to FACS analysis counting 10 000 events per gate. The number of scored events (y-axis) versus the respective fluorescence intensity of GFP (x-axis) is shown for huGFP0 and huGFP60 as well as for untransfected cells (mock) to monitor background fluorescence. (B) Stably transfected CHO cells were harvested and 50 µg of total protein were subjected to western blot analysis using a GFP-specific antibody. Two monoclonal and one polyclonal CHO cell line expressing either huGFP0 (lanes 2–4) or huGFP60 (lanes 5–7) were analysed. The monoclonal cell lines for huGFP0 are shown in lanes 2 and 3, the monoclonal cell lines for huGFP60 are depicted in lane 5 and 6. The positions of the 27-kDa GFP protein and the 42-kDa ß-Actin protein are indicated by arrows. Untransfected cells (mock, lane 1) served as negative control. (C) Polyclonal (poly) and monoclonal (mono) CHO cell lines (left) and polyclonal 293 cells (right) stably expressing either huGFP0 or huGFP60 were quantified for expression of the GFP reporter genes by FACS analysis over a period of 56 weeks (x-axis) indicated as mfi values (y-axis). Mocktransfected cells were used for background subtraction. (D) CHO cells stably expressing huGFP0 or huGFP60 under control of the EF-1α promoter were subjected to FACS analysis counting 10 000 events per gate. The number of scored events (y-axis) versus the respective fluorescence intensity of GFP (x-axis) is shown for huGFP0 and huGFP60 as well as for untransfected cells (mock) to monitor background fluorescence. (E) Polyclonal CHO cells stably expressing either huGFP0 or huGFP60 under control of the EF-1α promoter were quantified for expression of the GFP reporter genes by FACS analysis over a period of 15 weeks (x-axis) indicated as mfi values (y-axis). (F) Genomic DNA from stably transfected CHO cells was isolated, bisulphite-treated and amplified via PCR with huGFP specific oligonucleotides. PCR products were sequenced, and chromatograms were analysed as described in materials and methods. A section of huGFP60 sequence prior to (upper panel) and post bisulphite treatment (lower panel) is depicted, and cytosine residues potentially available for methylation are underlined. Unmethylated cytosines are represented by thymines the chromatogram, whereas methylated cytosines are not converted. The first nucleotide (G) of the extracted sequence corresponds to position 138 of the gfp open reading frame.
Figure 5.
Figure 5.
Influence of intragenic CpG depletion on translational efficiency. 293 cells were infected with MVA-T7 at an MOI of 10 and transfected with pS/huGFP0 and pS/huGFP60 1-h postinfection. After 48 h, GFP-specific transcripts were accurately measured via qPCR (B) and GFP expression in transfected cells was quantified by FACS analysis (A). The mfi of three independent transfection experiments is shown.
Figure 6.
Figure 6.
Influence of CpG content on steady-state RNA levels. Cytoplasmic and nuclear RNA fractions prepared from 3 × 10⁷ stably transfected CHO cells were subjected to reverse transcription and quantified via LightCycler analyses as described in materials and methods. (A): Relative quantification. The amount of gfp-specific transcripts (right) was related to hph (hygromycin resistance gene) transcripts (left), which served as internal controls in the same run. The x-axis denotes the cycle number (cp) necessary to significantly detect the SYBR Green fluorescence signal (y-axis) of the respective cDNA sample referring to cytoplasmic (upper panel) or nuclear RNA (lower panel). Melting point analysis for hph- (left) and gfp-specific RT-PCR products (right) compared to primer dimer formation is indicated below. Colour code: brown, hph; purple, huGFP0; green, huGFP60; black, primer dimer. (B): Absolute quantification. The amount of RNA transcripts was extrapolated from an external standard curve as described in ‘Materials and Methods’ section, and the number of cytoplasmic (left) and nuclear (right) RNA transcripts derived from three independent experiments is given.
Figure 7.
Figure 7.
Influence of intragenic CpG content on stability and alternative splicing of the GFP transcripts. (A) Stably GFP expressing CHO cells were treated with 2.4 μM Actinomycin D at different time points prior to cell harvest. Total RNA was isolated, reverse transcribed, and the resulting cDNA samples were quantified via LightCycler using SYBR Green technology. (B) RNA half-lives (y-axis) of the respective transcripts (x-axis) were determined as described in ‘Material and Methods’ section. Shown data represent the mean of two independent experiments performed in triplicates using ß-actin RNA as a control. (C) To detect alternative splice products, RNA samples from cytoplasmic and nuclear fractions of stably transfected CHO cells were subjected to reverse transcription and qualitative PCR analysis. Obtained PCR products referring to cytoplasmic (c) or nuclear (n) huGFP0 (lanes 1 and 2) or huGFP60 (lanes 3 and 4) transcripts were analysed by 1% agarose gel electrophoresis. Genomic DNA (gDNA) and RNA from untransfected CHO cells (CHO) (lane 7) were used as positive and negative PCR controls, respectively. Nucleotide positions are indicated on the right.
Figure 8.
Figure 8.
Influence of CpG depletion on de novo synthesis of gfp-specific transcripts. The nuclear run-on assay was performed with stably transfected CHO cells by supplying nuclei with biotin-16-UTP. Labelled transcripts were bound to streptavidin-coated magnetic beads, and total cDNA was synthesized by means of random hexamer-primed reverse transcription of captured molecules. Absolute cDNA copy numbers obtained from newly synthesized mRNA transcripts were quantified via LightCycler and normalized to ß-actin transcripts. The mean of two independent experiments performed in duplicates is shown.
Figure 9.
Figure 9.
Influence of intragenic CpG content on nucleosome positioning in vitro. Three fragments of similar length, huGFPI (300 bp), huGFPII (280 bp) and huGFPIII (299 bp), were amplified from pcDNA5/FRT, containing the respective huGFP variants. The huGFP fragments were reconstituted with defined histone concentrations in the presence of competitor DNA (pUC 19), followed by salt dialysis, PAGE and detection by UV. The pattern of nucleoprotein bands fractionated by PAGE is characteristic for each of the fragments. Bands which represent nucleosome positions that are not specified for a single gene variant are indicated as dashed arrows. Bands characteristic for only one specific gene variant are highlighted by arrows.
Figure 10.
Figure 10.
Influence of intragenic CpG dinucleotides on histone density in vivo. The ChIP experiment was performed by cross-linking DNA of stably transfected CHO cells, incubating the DNA with a pan H3 specific antibody and collecting DNA with protein A sepharose. Precipitated DNA was quantified via qPCR. Data obtained for DNA amounts at the TSS of the two gfp gene variants were normalized to the corresponding ß-actin (actin) amounts. The mean of two independent experiments is shown.

References

    1. Valente CA, Monteiro GA, Cabral JM, Fevereiro M, Prazeres DM. Optimization of the primary recovery of human interferon Alpha2b from Escherichia Coli inclusion bodies. Protein Expr. Purif. 2006;45:226–234. - PubMed
    1. Barrett JW, Sun Y, Nazarian SH, Belsito TA, Brunetti CR, Mcfadden G. Optimization of codon usage of poxvirus genes allows for improved transient expression in mammalian cells. Virus Genes. 2006;33:15–26. - PMC - PubMed
    1. Barnes LM, Dickson AJ. Mammalian cell factories for efficient and stable protein expression. Curr. Opin. Biotechnol. 2006;17:381–386. - PubMed
    1. Jenkins N, Murphy L, Tyther R. Post-Translational modifications of recombinant proteins: significance for biopharmaceuticals. Mol. Biotechnol. 2008;39:113–118. - PubMed
    1. Ill CR, Chiou HC. Gene therapy progress and prospects: recent progress in transgene and Rnai expression cassettes. Gene Ther. 2005;12:795–802. - PubMed

Publication types

LinkOut - more resources