. 2010 Mar 3;30(9):3347-57.
doi: 10.1523/JNEUROSCI.5267-09.2010.

Type 3 deiodinase, a thyroid-hormone-inactivating enzyme, controls survival and maturation of cone photoreceptors

Affiliations

Type 3 deiodinase, a thyroid-hormone-inactivating enzyme, controls survival and maturation of cone photoreceptors

Lily Ng et al. J Neurosci. .

Abstract

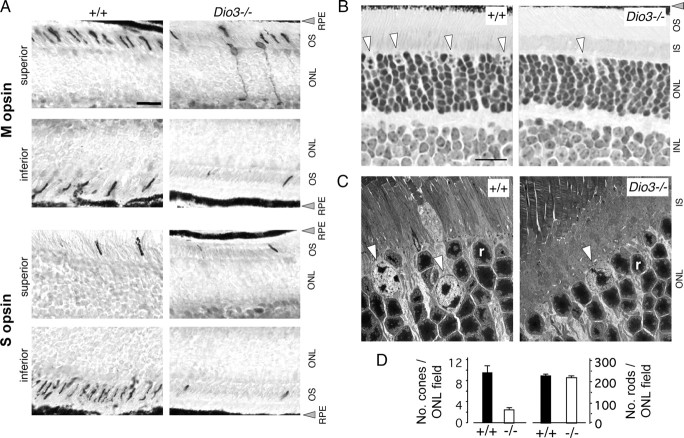
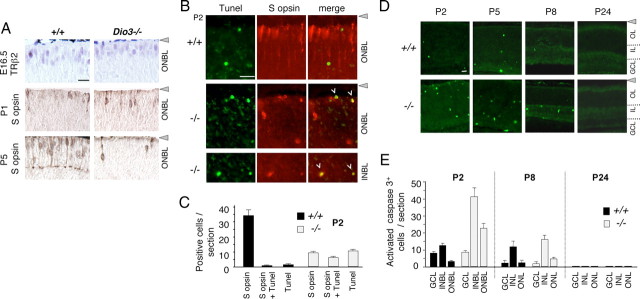
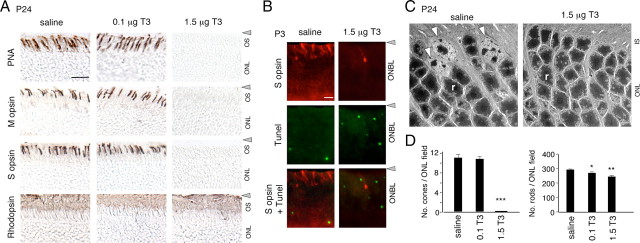
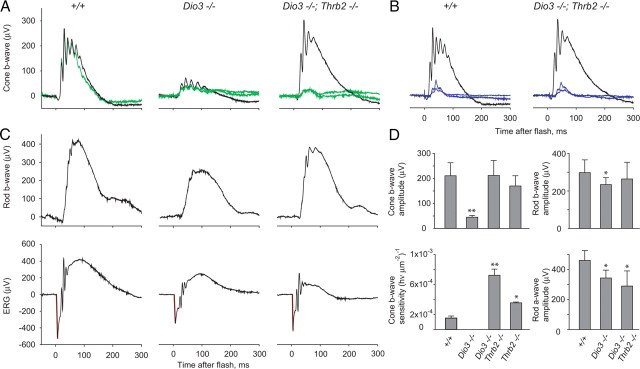
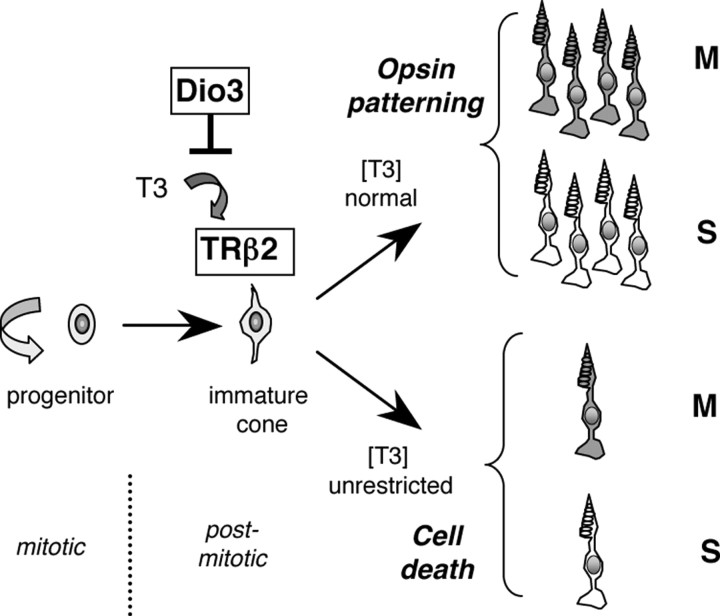
Maturation of the mammalian nervous system requires adequate provision of thyroid hormone and mechanisms that enhance tissue responses to the hormone. Here, we report that the development of cones, the photoreceptors for daylight and color vision, requires protection from thyroid hormone by type 3 deiodinase, a thyroid hormone-inactivating enzyme. Type 3 deiodinase, encoded by Dio3, is expressed in the immature mouse retina. In Dio3(-/-) mice, approximately 80% of cones are lost through neonatal cell death. Cones that express opsin photopigments for response to both short (S) and medium-long (M) wavelength light are lost. Rod photoreceptors, which mediate dim light vision, remain essentially intact. Excessive thyroid hormone in wild-type pups also eliminates cones. Cone loss is mediated by cone-specific thyroid hormone receptor beta2 (TRbeta2) as deletion of TRbeta2 rescues cones in Dio3(-/-) mice. However, rescued cones respond to short but not longer wavelength light because TRbeta2 under moderate hormonal stimulation normally induces M opsin and controls the patterning of M and S opsins over the retina. The results suggest that type 3 deiodinase limits hormonal exposure of the cone to levels that safeguard both cone survival and the patterning of opsins that is required for cone function.


Figures

Figure 1.
Figure 1.
Type 3 deiodinase expression in retinal development. A, Type 3 deiodinase activity in mouse eye homogenates. Activity was determined for pools of eyes at the ages indicated. Note that the x-axis scale differs at embryonic and postnatal ages. B, Northern blot detection of Dio3 mRNA in eye development. The main 2.2 kb Dio3 mRNA in eye was similar to that reported in the cochlea (Ng et al., 2009b). Brain and liver are positive and negative control tissues for Dio3 expression. 28S, rRNA control for RNA integrity detected by methylene blue staining. C, In situ hybridization detected Dio3 mRNA in all layers of the immature neural retina at E16.5 (top). Higher-magnification (bottom) shows signals for Dio3 at E18.5 and P2 and a control sense strand probe at P2. GCL, Ganglion cell layer; RPE, retinal pigmented epithelium. Scale bars: top, 50 μm; bottom, 20 μm. D, Loss of retinal type 3 deiodination in Dio3−/− mice. Plots show mean ± SD activity determined for individual pairs of eyes from 7 +/+, 21 +/−, and 12 −/− embryos at E18.5.
Figure 2.
Figure 2.
Requirement for Dio3 in cone development. A, Immunostaining of retinal sections for M and S opsin+ cones in 2-month-old +/+ and Dio3−/− mice. In +/+ mice, M and S opsins are detected in outer segments (OS) with opposing distribution gradients across the superior–inferior axis of the retina. Dio3−/− mice lacked most M and S opsin+ cones; some residual cones displayed opsin mislocalized in the cell body, axon, and pedicle. Sections were lightly counterstained with hematoxylin. INL, Inner nuclear layer; RPE, retinal pigmented epithelium (gray arrowhead). Scale bar, 20 μm. B, Retinal histology. Methacrylate sections stained with hematoxylin and eosin showing absence of most cones in adult Dio3−/− mice. Arrowheads identify cone nuclei at the outer edge of the photoreceptor layer (ONL). Cones are sparse in the ONL, most of which consists of small, dense rod nuclei. IS, Inner segment layer. Scale bar, 20 μm. C, Transmission electron micrographs of retina showing cones (arrowheads) and rods (r) in 3-month-old mice (2500× magnification). Fewer cone nuclei were present in Dio3−/− mice than in +/+ mice, and some remaining cones showed a less distinct morphology than in +/+ mice. D, Counts of cone and rod nuclei. Counts were determined as described in Materials and Methods and are shown as means ± SD determined for 165-μm-long ONL fields on 3-μm-thick methacrylate sections. Dio3−/− mice had ∼20% of +/+ cone numbers (p < 0.0001). Rod numbers were not significantly different.
Figure 3.
Figure 3.
Cone cell death in Dio3−/− pups. A, Immunostaining for early cone markers. A newly generated cone population (TRβ2+) was detected in both +/+ and Dio3−/− mice at E16.5. S opsin+ cones were also present in both genotypes at P1, but most cones were lost in Dio3−/− mice between P1 and P5. Scale bar, 20 μm. B, Fluorescence detection of TUNEL+ (green) and S opsin+ (red) cells in +/+ and Dio3−/− pups at P2. Dio3−/− pups exhibit increased numbers of TUNEL+ and TUNEL+/S opsin+ double-positive cells (yellow, merge). In +/+ pups, most S opsin+ cones resided near the edge of the ONBL, but, in Dio3−/− pups, many of the remaining S opsin+ cones were dispersed in the INBL and ONBL. Scale bar, 20 μm. C, Counts of S opsin+, TUNEL+, and double-positive (TUNEL+/S opsin+) cells at P2. Counts were determined in midretinal fields (400-μm-long fields) on 10 μm cryosections. Groups, n = 6 eyes from 3 mice. D, Immunostaining for activated caspase 3+ cells in retina in +/+ and Dio3−/− mice during development at postnatal stages. Positive cell numbers increased in Dio3−/− mice in the ONBL and INBL at P2–P8. IL, Inner layers (inner neuroblastic at P2, P5 or inner nuclear at P8, P24); OL, outer layers (outer neuroblastic at P2, P5 or outer nuclear at P8, 24); GCL, ganglion cell layer. Scale bar, 20 μm. E, Counts of activated caspase 3+ cells determined over the full length of midretinal, 10-μm-thick cryosections. Groups, n = 4–8 eyes from 2–4 mice per age.
Figure 4.
Figure 4.
Excessive T3 leads to cone loss in neonatal +/+ mice. A, Analysis of cone and rod markers at P24 after previous injections (daily subcutaneously) of saline or high (0.1 μg) or extremely high (1.5 μg) T3 doses in +/+ pups from P0-P3. The highest T3 doses eliminated identifiable cones using any marker (S opsins, M opsins, PNA). Rhodopsin+ rods remained intact. OS, Outer segment. Scale bar, 20 μm. B, Analysis of S opsin and TUNEL staining in retina in pups at P3 after injections of 1.5 μg of T3 given daily from P0-P3. T3 gave a near complete loss of S opsin+ cones and increased numbers of TUNEL+ cells. A rare residual S opsin+ cell is shown. Scale bar, 20 μm. C, Transmission electron micrographs of +/+ mouse retina at P24 after previous injections with saline or 1.5 μg of T3 at P0-P3 (2500× magnification). Rods (r) and cones (arrowheads) are indicated. T3 treatment eliminated cones. IS, Inner segment. D, Cone and rod counts in +/+ mice determined at P24 after previous injection at P0-P3 of saline, or 0.1 or 1.5 μg/d T3. A dose of 1.5 μg/d T3 eliminated cones (***p = 3.8 × 10⁻¹⁰), but 0.1 μg/d T3 gave no significant cone loss (p = 0.78) compared with saline treatment. Rod numbers were slightly decreased by 0.1 μg/d T3 (*p = 0.02) and 1.5 μg/d T3 (**p = 7.1 × 10⁻⁵). Rod and cone nuclei were counted in 210-μm-long ONL fields on 3-μm-thick methacrylate sections. Groups, n = 5 eyes from 5 mice.
Figure 5.
Figure 5.
TRβ2 mediates cone loss in Dio3−/− mice. A, Immunostaining for M and S opsins in retina of mice of genotypes indicated at P24. Dio3−/− mice exhibited reduced cone numbers and also an incidence of mislocated opsin+ cells in the INL and unusual cells with staining in the axon and pedicle. S opsin+ cones were recovered in Dio3−/−;Thrb2−/− mice compared with Dio3−/− mice. In Dio3−/−;Thrb2−/− mice, recovered cones were almost exclusively S opsin+ and lacked M opsin, as in Thrb2−/− mice. Most recovered cones were correctly located at the edge of the ONL in Dio3−/−;Thrb2−/− mice. OS, Outer segment. Scale bar, 20 μm. B, Counts of S and M opsin+ cones in Dio3−/− and Dio3−/−;Thrb2−/− mice. Counts were determined in 100-μm-long ONL fields on 10 μm cryosections in each of the four zones shown in the inset eye diagram. Boxes indicate zones in superior and inferior retina. Groups, n = 6 eyes from 3 mice.
Figure 6.
Figure 6.
Electroretinogram responses in Dio3−/− and Dio3−/−;Thrb2−/− mice. A, Full-field cone-driven responses to achromatic and long wavelength stimuli. Black traces, Saturating responses to bright (2000 scotopic cd m−2) white flashes (total cone response); green traces, responses to orange (λ > 530 nm) flashes (M opsin+ cone response). In +/+ mice, an orange flash of 600 scotopic cd m−2 elicits a response almost identical to the saturating response to a white stimulus, indicating that most cones express some M opsin (Lyubarsky et al., 1999). In Dio3−/− mice, amplitudes of saturating responses to white and orange flashes are approximately fivefold smaller than in +/+ mice. In Dio3−/−;Thrb2−/− mice, white flashes elicit saturating cone responses of normal magnitude, but orange flashes of any intensity (70 and 600 scotopic cd m−2) (green traces) generate only a small response consistent with lack of M opsin. B, Cone-driven ERGs generated by short wavelength stimuli. Black traces, Saturating responses elicited with bright (2000 scotopic cd m−2) white flashes. Blue traces, Responses to ultraviolet (360 nm) flashes with estimated intensities of (photons μm−2 at the retina) 660 and 1320 for +/+ mice and 140 and 250 for Dio3−/−;Thrb2−/− mice. Similar magnitudes of response are elicited with approximately fivefold dimmer stimulus in Dio3−/−;Thrb2−/− than in +/+ mice. C, ERGs of dark-adapted mice. Top, Responses to dim (0.02 scotopic cd s m−2) flashes of green (510 nm) light. In these conditions, ERGs are represented by rod-driven (scotopic) b-waves of saturating magnitude and reflect primarily the magnitude of the circulating current of the rod bipolar cells. Bottom, Responses to bright (200 scotopic cd s m−2) achromatic flashes that saturate the a-wave amplitude, which is proportional to the circulating current of the rod photoreceptors. The corneal negative a-wave component is highlighted in red. D, Bar charts of mean ± SD values for ERG components and properties illustrated in A–C for groups of mice: 10 +/+, 7 Dio3−/−, 6 Dio3−/−;Thrb2−/−, 8 Thrb2−/−. Statistically significant differences in mutant mouse groups compared with +/+ mice are indicated: *p < 0.05; **p < 0.01 (one-tailed t tests).
Figure 7.
Figure 7.
Properties of S opsin dominant cones in ventral retina of +/+, Dio3−/−;Thrb2−/−, and Thrb2−/− mice. Each row presents data recorded from a single cone of a +/+ (A–C), a Thrb2−/− (D–F), and a Dio3−/−;Thrb2−/− (G–I) mouse. A, D, G, Response families, normalized by the estimated maximum response amplitude corresponding to the complete suppression of the light sensitive current (short gray horizontal lines). B, E, H, Responses from corresponding panels in the first column on the expanded timescale (black traces) together with theoretical predictions of the response rising phases (gray traces) (Pugh and Lamb, 1993; Nikonov et al., 2006); the estimated values of the amplification constant A for each cone are shown. C, F, I, Normalized amplitude versus flash intensity data (left ordinates) and time to 40% recovery versus flash intensity data (right ordinates) for the corresponding response families in the first column. The amplitude versus flash intensity data were fitted with exponential saturation functions: the intensities Qe that drive the cell to 1/e of saturation are shown. Recovery times for responses to saturating flashes were fitted with straight lines to estimate dominant recovery time constants (τD) (Pepperberg et al., 1992). J, Plot of the spectral sensitivity of one +/+ cone (open circles), four Thrb2−/− cones (blue circles, diamonds, triangles, and inverted triangles, each representing a single cone), and one Dio3−/−;Thrb2−/− cone (red diamond; for a second Dio3−/−;Thrb2−/− cone, responses at 501 nm were too insensitive to be measured). The data of each genotype are describable as the combination of opsin template spectra (Lamb, 1995) for opsins with λmax at 360 nm (mouse S opsin) and 508 nm (mouse M opsin), respectively: the S opsin template is scaled to unity, whereas the M opsin template has been scaled to fit the data above 500 nm. The scaling factor provides an estimate of the fraction of M opsin coexpression in S dominant cones (Nikonov et al., 2006, 2008). Gray error bar at 508 nm plots a 99% confidence interval for M opsin coexpression in S dominant cones of +/+ mice derived from 30 cones.
Figure 8.
Figure 8.
Diagram of the central role of TRβ2 in cone maturation and the role of Dio3 in limiting stimulation by T3 to beneficial levels. TRβ2 is expressed in newly generated cones in mice and directs M opsin induction and differential patterning of M and S opsins in cones over the retina. Some amount of T3 is necessary for TRβ2 to induce M opsin and promote M and S opsin patterning. However, type 3 deiodinase constrains the exposure to T3 to prevent TRβ2-mediated cone cell death.

References

    1. Allison WT, Dann SG, Veldhoen KM, Hawryshyn CW. Degeneration and regeneration of ultraviolet cone photoreceptors during development in rainbow trout. J Comp Neurol. 2006;499:702–715. - PubMed
    1. Applebury ML, Antoch MP, Baxter LC, Chun LL, Falk JD, Farhangfar F, Kage K, Krzystolik MG, Lyass LA, Robbins JT. The murine cone photoreceptor: a single cone type expresses both S and M opsins with retinal spatial patterning. Neuron. 2000;27:513–523. - PubMed
    1. Becker KB, Stephens KC, Davey JC, Schneider MJ, Galton VA. The type 2 and type 3 iodothyronine deiodinases play important roles in coordinating development in Rana catesbeiana tadpoles. Endocrinology. 1997;138:2989–2997. - PubMed
    1. Bianco AC, Salvatore D, Gereben B, Berry MJ, Larsen PR. Biochemistry, cellular and molecular biology, and physiological roles of the iodothyronine selenodeiodinases. Endocr Rev. 2002;23:38–89. - PubMed
    1. Cao XY, Jiang XM, Dou ZH, Rakeman MA, Zhang ML, O'Donnell K, Ma T, Amette K, DeLong N, DeLong GR. Timing of vulnerability of the brain to iodine deficiency in endemic cretinism. N Engl J Med. 1994;331:1739–1744. - PubMed

Publication types

MeSH terms