. 2010 Mar 3;30(9):3419-31.
doi: 10.1523/JNEUROSCI.4231-09.2010.

Impact of actin filament stabilization on adult hippocampal and olfactory bulb neurogenesis

Affiliations

Impact of actin filament stabilization on adult hippocampal and olfactory bulb neurogenesis

Golo Kronenberg et al. J Neurosci. .

Abstract

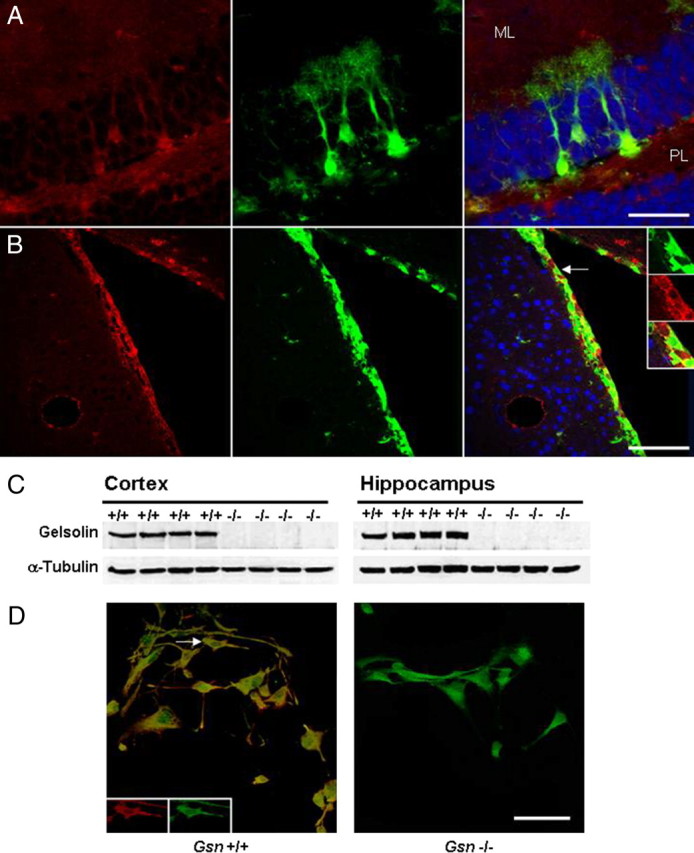
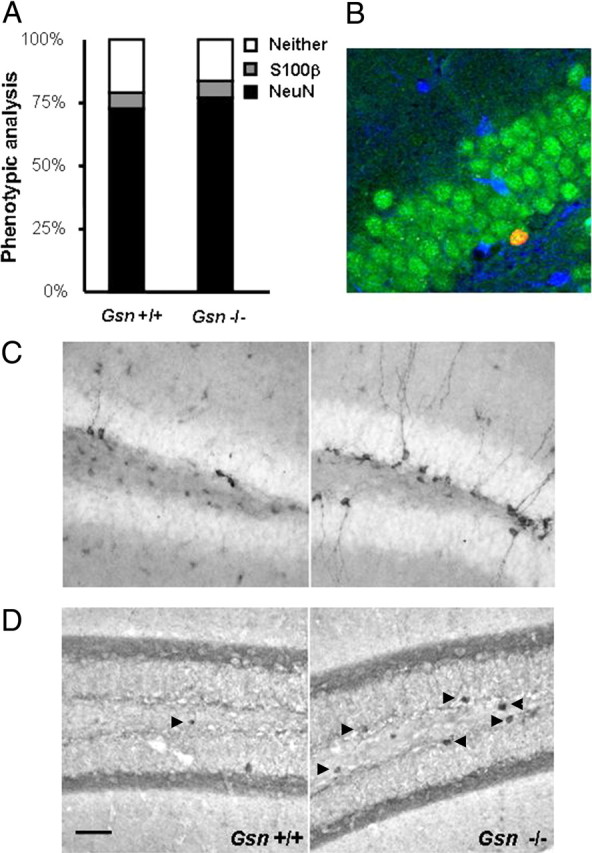
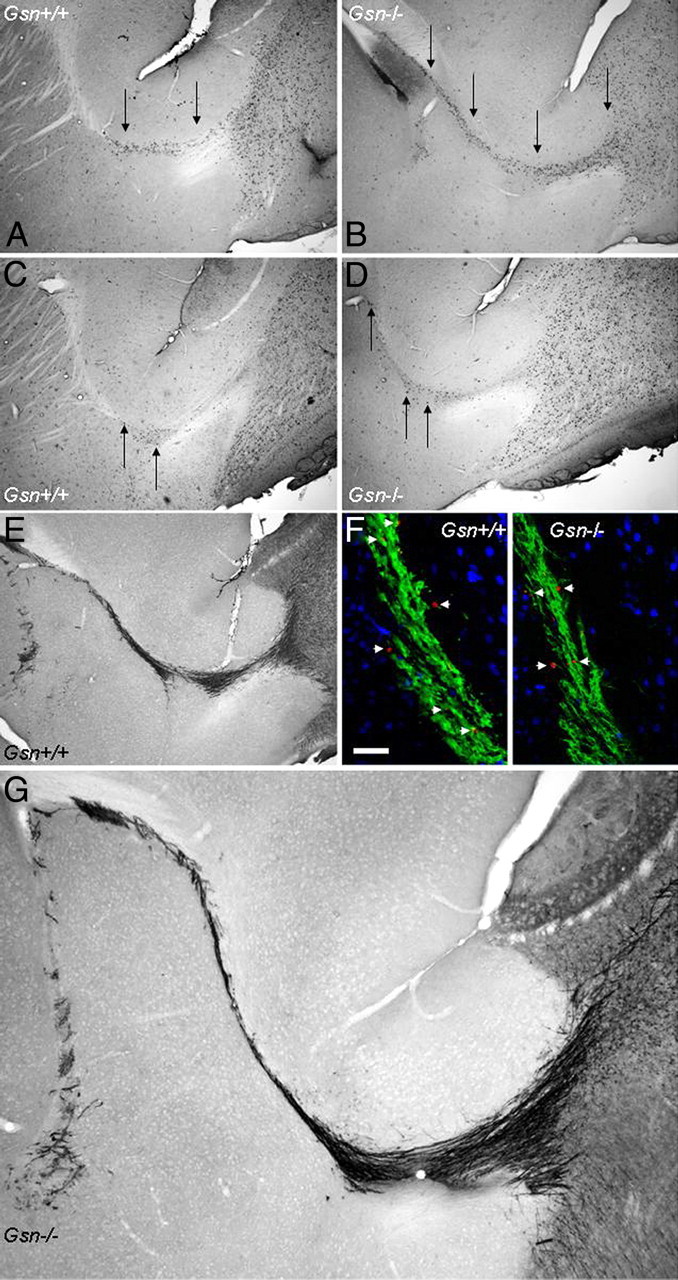
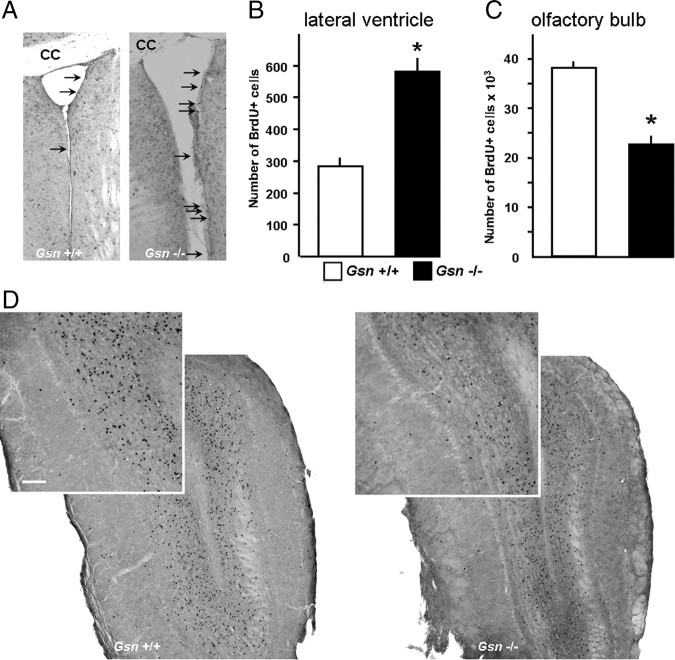
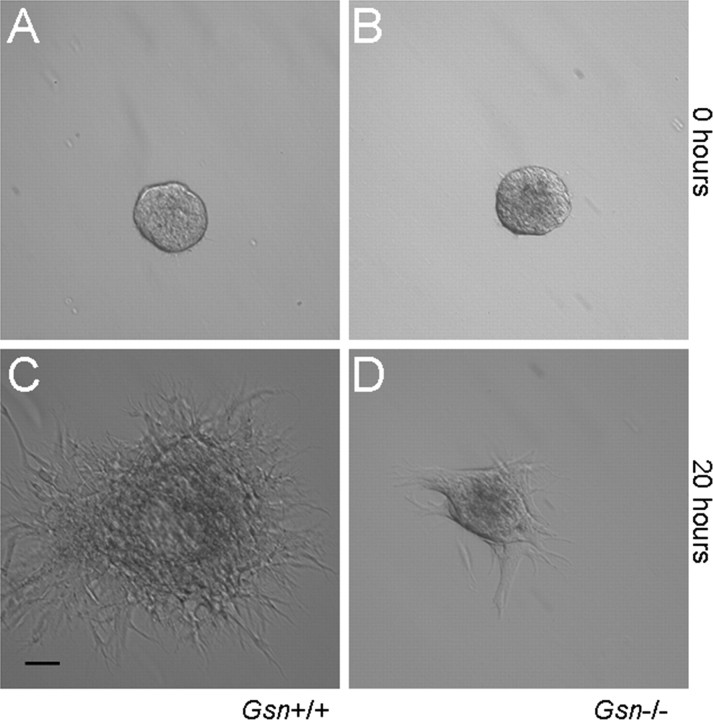
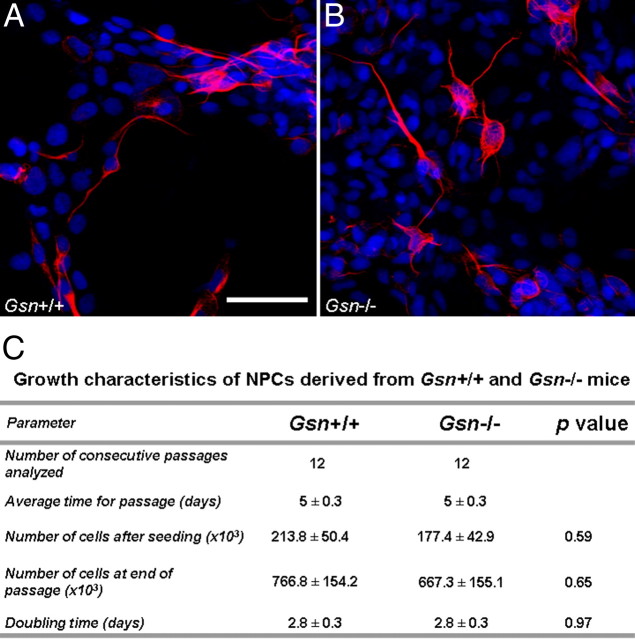
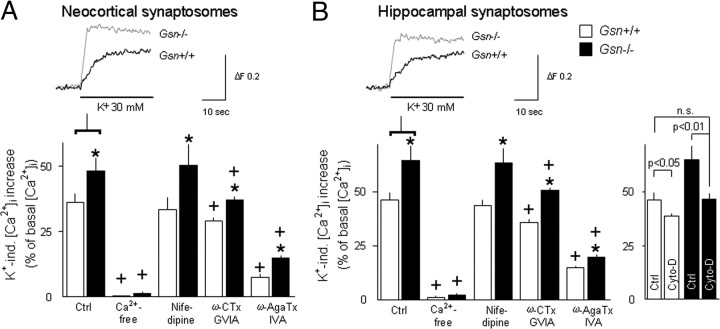
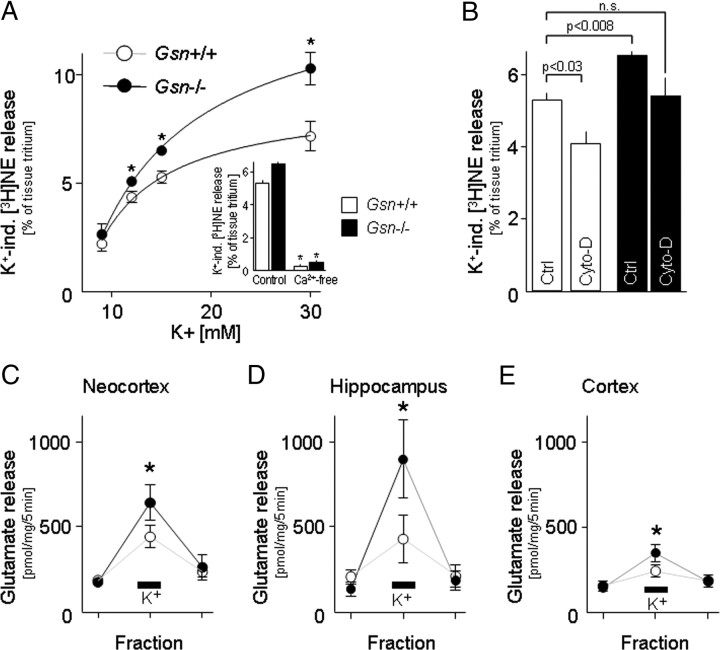
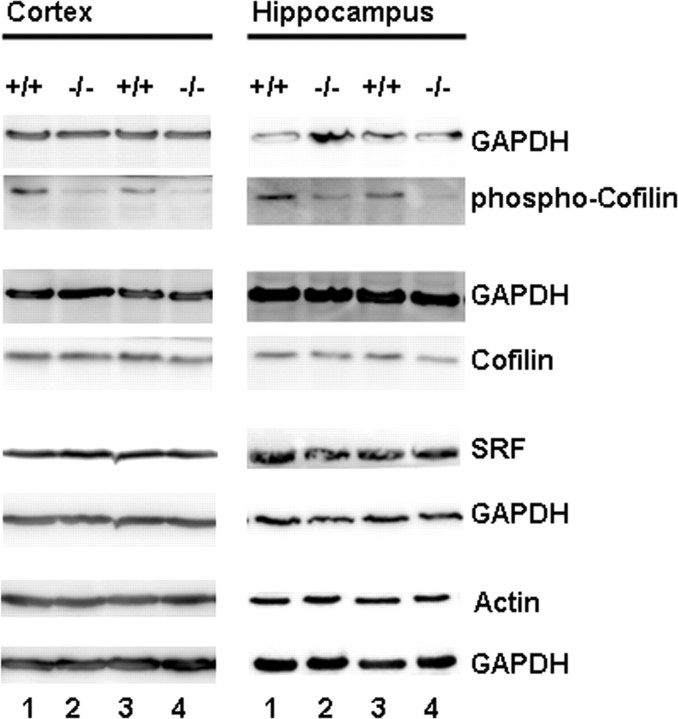
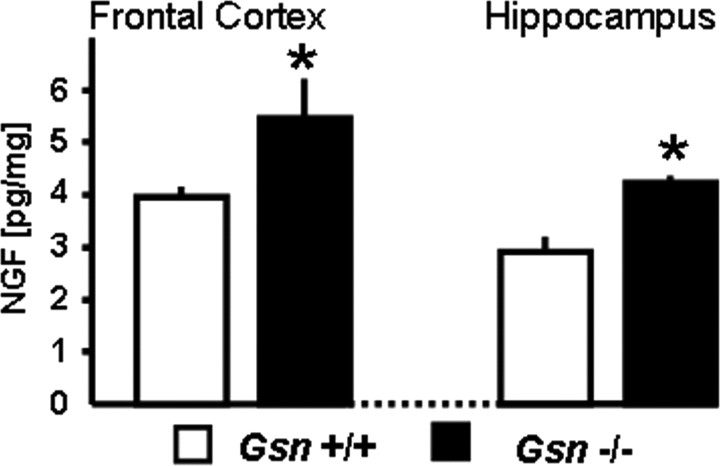
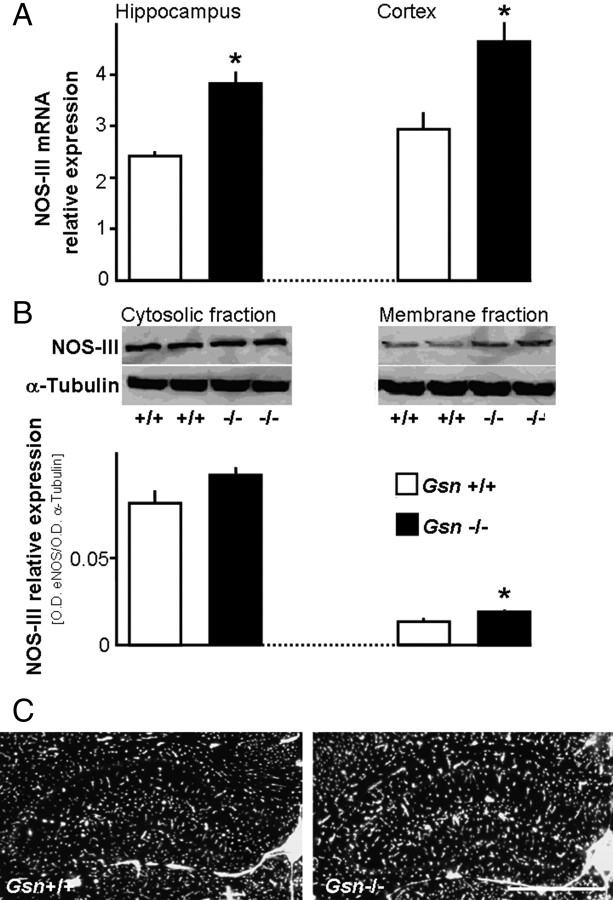
Rearrangement of the actin cytoskeleton is essential for dynamic cellular processes. Decreased actin turnover and rigidity of cytoskeletal structures have been associated with aging and cell death. Gelsolin is a Ca(2+)-activated actin-severing protein that is widely expressed throughout the adult mammalian brain. Here, we used gelsolin-deficient (Gsn(-/-)) mice as a model system for actin filament stabilization. In Gsn(-/-) mice, emigration of newly generated cells from the subventricular zone into the olfactory bulb was slowed. In vitro, gelsolin deficiency did not affect proliferation or neuronal differentiation of adult neural progenitors cells (NPCs) but resulted in retarded migration. Surprisingly, hippocampal neurogenesis was robustly induced by gelsolin deficiency. The ability of NPCs to intrinsically sense excitatory activity and thereby implement coupling between network activity and neurogenesis has recently been established. Depolarization-induced [Ca(2+)](i) increases and exocytotic neurotransmitter release were enhanced in Gsn(-/-) synaptosomes. Importantly, treatment of Gsn(-/-) synaptosomes with mycotoxin cytochalasin D, which, like gelsolin, produces actin disassembly, decreased enhanced Ca(2+) influx and subsequent exocytotic norepinephrine release to wild-type levels. Similarly, depolarization-induced glutamate release from Gsn(-/-) brain slices was increased. Furthermore, increased hippocampal neurogenesis in Gsn(-/-) mice was associated with a special microenvironment characterized by enhanced density of perfused vessels, increased regional cerebral blood flow, and increased endothelial nitric oxide synthase (NOS-III) expression in hippocampus. Together, reduced filamentous actin turnover in presynaptic terminals causes increased Ca(2+) influx and, subsequently, elevated exocytotic neurotransmitter release acting on neural progenitors. Increased neurogenesis in Gsn(-/-) hippocampus is associated with a special vascular niche for neurogenesis.


Figures

Figure 1.
Figure 1.
Gelsolin expression in adult neural progenitor cells. Characterization of gelsolin expression (red) in the hippocampal dentate gyrus (A) and in the subventricular zone (B) of 3- to 4-month-old nestin-GFP (green) reporter mice. Blue, Neuronal marker NeuN. A, Confocal image demonstrating gelsolin expression in the cell bodies and processes of radial glia-like nestin-GFP cells in the hippocampal dentate gyrus. Note that, in the granule cell layer, gelsolin is also expressed in neurons. Furthermore, there is widespread gelsolin staining in the neuropil of the molecular layer (ML) and of the polymorphic layer (PL). B, Gelsolin expression in neural progenitors of the subventricular zone. The insets show higher magnification of the nestin-GFP cell marked by arrow. C, Western blot analysis of protein extracts with gelsolin antibody confirms lack of gelsolin in Gsn−/− mice. D, Whereas cultures of neural progenitors derived from Gsn+/+ mice show gelsolin immunoreactivity, neural progenitors from Gsn−/− mice lack gelsolin. Green, Nestin protein. The insets show cell marked by arrow in single channels with separate wavelengths. Scale bars: A, 50 μm; B, 100 μm; D, 50 μm.
Figure 2.
Figure 2.
Increased hippocampal neurogenesis in Gsn−/− mice. A, B, Hippocampal neurogenesis was assessed in 4- to 5-month-old mice after a 4 week delay between BrdU injections and killing. Whereas the number of BrdU+ cells was strongly increased in Gsn−/− animals (more than threefold), neuronal versus glial fate commitment did not differ significantly between genotypes. B, Confocal image illustrating newly generated neuron in the dentate gyrus of Gsn−/− mouse. Green, Neuronal marker NeuN. Red, BrdU. Blue, Astrocytic marker S100β. C, D, The number of DCX- and CR-expressing cells was used as a surrogate marker to assess hippocampal neurogenesis in 14- to 16-month-old mice. Representative images of DCX immunoreactivity (C) and CR immunoreactivity (D) in the hippocampal dentate gyrus of Gsn−/− mice and wild-type controls. Scale bar: (in D) B, 23 μm; C, D, 50 μm.
Figure 3.
Figure 3.
Impairment of RMS migration in Gsn−/− mice. A–D, Migration of newly generated cells through the rostral migratory stream was analyzed in a BrdU pulse chase experiment. Representative parasagittal images of the distribution of BrdU immunoreactivity at 10 (A, B) and 17 (C, D) days after a 5 d course of daily intraperitoneal BrdU demonstrates that BrdU+ cells of Gsn−/− mice (B, D) remain in the RMS longer and travel more slowly compared with BrdU+ cells of Gsn+/+ mice (A, C). The arrows mark BrdU+ cells in the rostral migratory stream. E, G, There were no apparent differences in the pattern of DCX staining in the RMS between genotypes. F, Furthermore, TUNEL staining (red) of the RMS (DCX, green) in parasagittal brain sections did not reveal significant differences between Gsn+/+ and Gsn−/− mice. Arrowheads, TUNEL+ nuclei. Blue, NeuN. Scale bar: (in F) 50 μm.
Figure 4.
Figure 4.
More BrdU+ cells in the lateral ventricle wall and fewer BrdU+ cells in the olfactory bulb of Gsn−/− mice. A, B, BrdU+ cells in the lateral ventricle wall (marked by arrows) were determined in every sixth section from the appearance of the third ventricle to the disappearance of the anterior commissure. Animals were killed 30 d after BrdU treatment. C, D, BrdU+ cells in the olfactory bulb were quantified bilaterally at every third section using unbiased stereology as described in Materials and Methods. The number of BrdU+ cells was significantly reduced in Gsn−/− animals at 30 d after a series of BrdU injections. Scale bar: D, insets, 100 μm. n = 4 animals per genotype. *p < 0.05. Error bars indicate SEM.
Figure 5.
Figure 5.
Gelsolin deficiency impairs neural progenitor cell migration in vitro. A–D, Representative micrographs illustrating slowed migration of Gsn−/− compared with Gsn+/+ cells out of neurospheres seeded in Matrigel during a 20 h period. The greatest distance a cell had migrated out of the sphere at 20 h was recorded using LAS software. Scale bar: (in C) 50 μm. Quantitative data of migration distances in the Matrigel assay are given in the text.
Figure 6.
Figure 6.
Gelsolin deficiency does not affect neuronal differentiation or proliferation kinetics of NPCs in vitro. A–C, Seven days after dissociation and culturing under differentiation conditions, cells were analyzed for expression of neuronal marker TuJ-1 (red). The percentage of cells expressing TuJ-1 did not differ significantly between genotypes (Gsn+/+, 26 ± 3.2; Gsn−/−, 28.8 ± 6.9; analysis of at least 3 × 200 cells per genotype). The images in A and B represent projections of confocal z-series (stack depth, 15 μm each). Blue, DAPI counterstain. C, Summary of growth characteristics. Scale bar: (in A) 50 μm.
Figure 7.
Figure 7.
Gelsolin deficiency confers increased synaptosomal Ca2+ influx. Gelsolin deficiency boosts K+-induced [Ca2+]i increase in Fura-2-loaded neocortical (A) or hippocampal (B) synaptosomes. For depolarization, K+ was elevated to 30 mm. The K+-induced [Ca2+]i increase is presented as percentage of basal cytosolic Ca2+ concentrations. The insets in A and B show representative fluorescence traces of control experiments. Note that, in Gsn−/− synaptosomes, [Ca2+]i increases faster and to a higher level than in wild-type synaptosomes. Although L-type voltage-dependent Ca2+ channel blocker nifedipine (1 μm) does not exert an effect on K+-induced [Ca2+]i increase both N-type voltage-dependent Ca2+ channel blocker ω-conotoxin GVIA (ω-CTx GVIA) (100 nm) and P/Q-type voltage-dependent Ca2+ channel blocker ω-agatoxin IVA (ω-AgaTx IVA) (200 nm) markedly reduce K+-induced [Ca2+]i increase independent of genotype. In contrast, cytochalasin D (Cyto-D) (1 μm), which mimics the effect of endogenous gelsolin, reverts the increased Ca2+ influx in Gsn−/− hippocampal synaptosomes to wild-type levels (B). Values given in A and B represent the means of five to nine experiments performed in duplicate. Error bars indicate SEM. *p < 0.05 compared with the corresponding wild-type controls within each experimental condition. +p < 0.05 compared with the same genotype within the control condition. ΔF represents the changes of fluorescence ratio excited at 340/380 nm.
Figure 8.
Figure 8.
Gelsolin deficiency confers increased exocytotic neurotransmitter release. A, B, Gelsolin deficiency boosts K+-induced release of tritium-labeled norepinephrine ([3H]NE) from neocortical synaptosomes. For depolarization, K+ was elevated to 9–30 mm (A) or to 15 mm (A, inset; B). K+-induced [3H]NE release is presented as percentage of total tissue tritium. The inset in A shows the results of Ca2+-free experiments. B, Cytochalasin D (Cyto-D) (1 μm) reduces the increased [3H]NE release in Gsn−/− synaptosomes to wild-type levels. Shown are means ± SEM of four to six experiments in quadruplicate. *p < 0.05 compared with the corresponding wild-type synaptosomes. C–E, K+-induced glutamate release in neocortical, hippocampal, or striatal slices is higher in Gsn−/− brains. For depolarization, K+ was elevated to 15 mm. Endogenous glutamate in the superfusate was collected in 5 min fractions and determined by HPLC. Glutamate release is presented in picomoles per milligram of brain tissue (wet weight). Shown are means ± SEM of 5–18 experiments. *p < 0.05 compared with the corresponding wild-type controls.
Figure 9.
Figure 9.
Dephosphorylation of cofilin in Gsn−/− mice. Western blot of protein extracts from hippocampus and frontal cortex of control (+/+) and gelsolin-deficient animals (−/−) probed with antibodies for actin, cofilin, phospho-cofilin, and SRF. Comparable loading of protein is confirmed by GAPDH staining.
Figure 10.
Figure 10.
Increased NGF levels in Gsn−/− mice. Tissue content of NGF determined at the protein level by ELISA is increased in Gsn−/− brain. N = 10 animals per genotype. *p < 0.05. Error bars indicate SEM.
Figure 11.
Figure 11.
Increased NOS-III expression and increased density of perfused microvessels in hippocampus of Gsn−/− mice. Relative NOS-III mRNA expression in hippocampus and in frontal cortex (A) is reported as the value × 1000 normalized to GAPDH for each sample (n = 4–5 animals per genotype). *p < 0.05. B, Hippocampal NOS-III protein expression. Western blots show similar NOS-III levels in cytosolic fractions (left) and increased levels in the membrane fractions (right) of Gsn−/− mouse hippocampus. Top panels, Representative blots of two different adult mice of either genotype. Bottom panels, Densitometrical quantification of the detected NOS-III bands, presented as ratios of NOS-III optical density (O.D.) over α-tubulin O.D. Error bars indicate SEM. C, Representative images of Evans blue staining in hippocampus of Gsn+/+ and Gsn−/− mice (10 μm cryostat sections). The density of perfused microvessels as determined using a tiled-field mapping technique and computer-assisted analysis was significantly increased by 14 microvessels/mm2 in Gsn−/− mice (F(1,16) = 4.6; p < 0.05). Correspondingly, absolute cerebral blood flow in hippocampus (milliliters · 100 g−1 · min−1) as assessed by the 14C-iodoantipyrine technique was also significantly increased in Gsn−/− mice (36.5 ± 2.9 vs 26.1 ± 1.9; F(1,16) = 8.7; p < 0.01). Scale bar: (in C) 1000 μm.

References

    1. Akopian A, Szikra T, Cristofanilli M, Krizaj D. Glutamate-induced Ca2+ influx in third-order neurons of salamander retina is regulated by the actin cytoskeleton. Neuroscience. 2006;138:17–24. - PMC - PubMed
    1. Alberti S, Krause SM, Kretz O, Philippar U, Lemberger T, Casanova E, Wiebel FF, Schwarz H, Frotscher M, Schütz G, Nordheim A. Neuronal migration in the murine rostral migratory stream requires serum response factor. Proc Natl Acad Sci U S A. 2005;102:6148–6153. - PMC - PubMed
    1. Azuma T, Witke W, Stossel TP, Hartwig JH, Kwiatkowski DJ. Gelsolin is a downstream effector of rac for fibroblast motility. EMBO J. 1998;17:1362–1370. - PMC - PubMed
    1. Baldwin ML, Rostas JA, Sim AT. Two modes of exocytosis from synaptosomes are differentially regulated by protein phosphatase types 2A and 2B. J Neurochem. 2003;85:1190–1199. - PubMed
    1. Bamburg JR. Proteins of the ADF/cofilin family: essential regulators of actin dynamics. Annu Rev Cell Dev Biol. 1999;15:185–230. - PubMed

Publication types

MeSH terms