

Reconstructing three-dimensional hand movements from noninvasive electroencephalographic signals
- PMID: 20203202
- PMCID: PMC6634107
- DOI: 10.1523/JNEUROSCI.6107-09.2010
Reconstructing three-dimensional hand movements from noninvasive electroencephalographic signals
Abstract
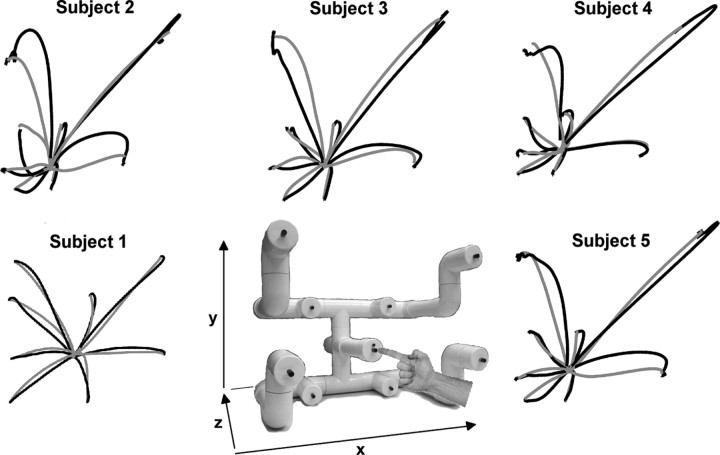
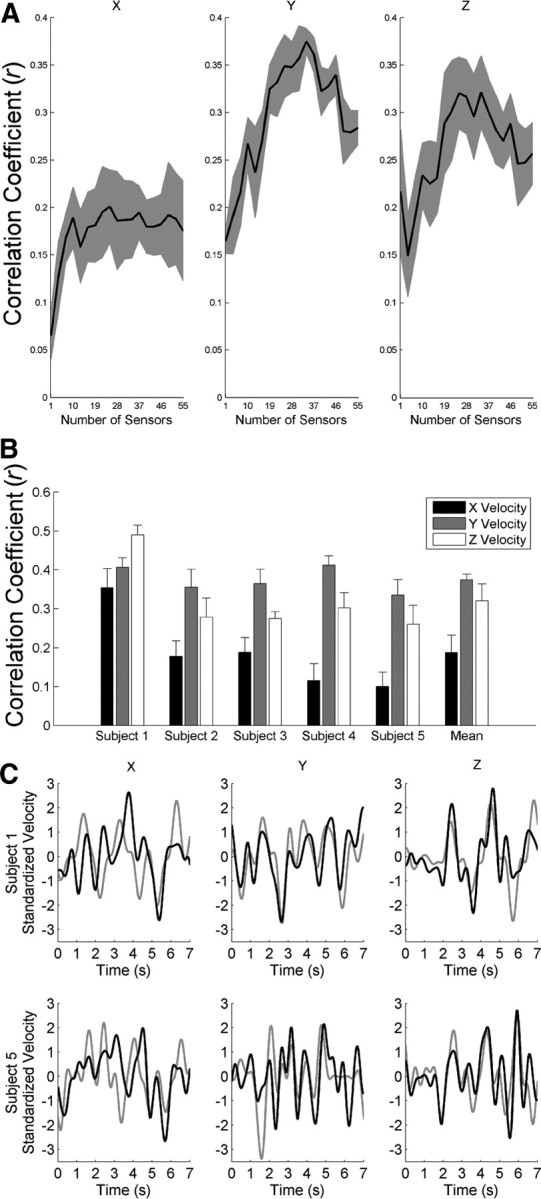
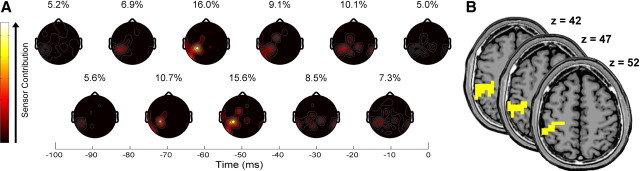
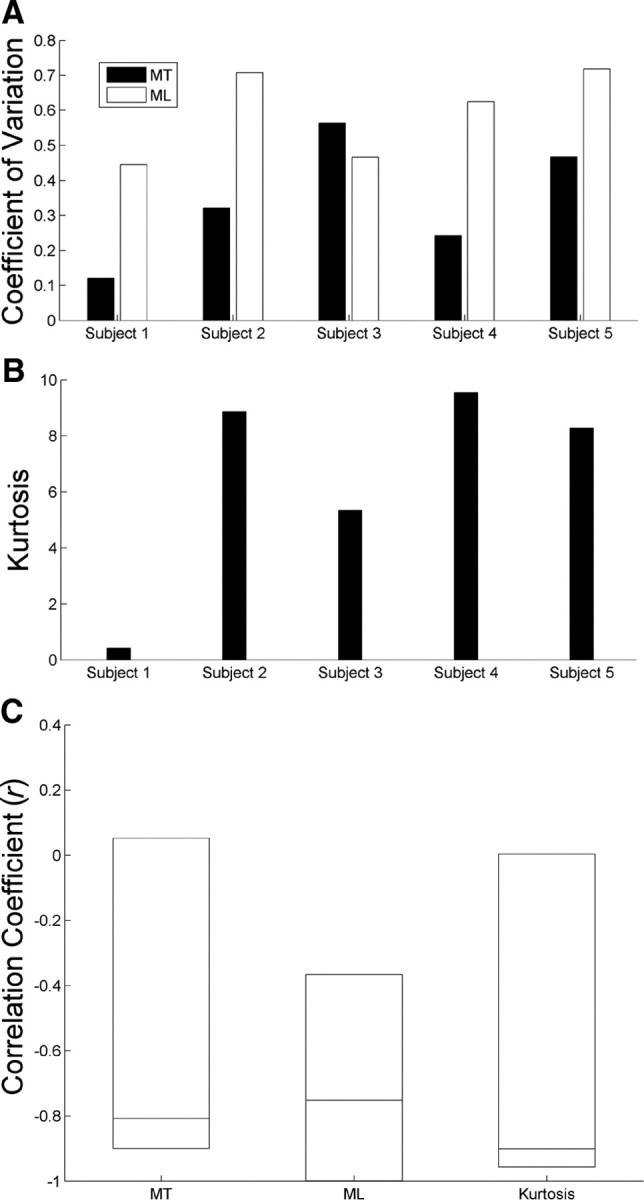
It is generally thought that the signal-to-noise ratio, the bandwidth, and the information content of neural data acquired via noninvasive scalp electroencephalography (EEG) are insufficient to extract detailed information about natural, multijoint movements of the upper limb. Here, we challenge this assumption by continuously decoding three-dimensional (3D) hand velocity from neural data acquired from the scalp with 55-channel EEG during a 3D center-out reaching task. To preserve ecological validity, five subjects self-initiated reaches and self-selected targets. Eye movements were controlled so they would not confound the interpretation of the results. With only 34 sensors, the correlation between measured and reconstructed velocity profiles compared reasonably well to that reported by studies that decoded hand kinematics from neural activity acquired intracranially. We subsequently examined the individual contributions of EEG sensors to decoding to find substantial involvement of scalp areas over the sensorimotor cortex contralateral to the reaching hand. Using standardized low-resolution brain electromagnetic tomography (sLORETA), we identified distributed current density sources related to hand velocity in the contralateral precentral gyrus, postcentral gyrus, and inferior parietal lobule. Furthermore, we discovered that movement variability negatively correlated with decoding accuracy, a finding to consider during the development of brain-computer interface systems. Overall, the ability to continuously decode 3D hand velocity from EEG during natural, center-out reaching holds promise for the furtherance of noninvasive neuromotor prostheses for movement-impaired individuals.
Figures
References
-
- Alpaydin E. Introduction to machine learning. Cambridge, MA: MIT; 2004. p. 254.
-
- Birbaumer N, Elbert T, Canavan AG, Rockstroh B. Slow potentials of the cerebral cortex and behavior. Physiol Rev. 1990;70:1–41. - PubMed
-
- Bradberry TJ, Contreras-Vidal JL, Rong F. Decoding hand and cursor kinematics from magnetoencephalographic signals during tool use. Conf Proc IEEE Eng Med Biol Soc. 2008;2008:5306–5309. - PubMed
-
- Bradberry TJ, Rong F, Contreras-Vidal JL. Decoding center-out hand velocity from MEG signals during visuomotor adaptation. Neuroimage. 2009a;47:1691–1700. - PubMed
-
- Bradberry TJ, Gentili RJ, Contreras-Vidal JL. Decoding three-dimensional hand kinematics from electroencephalographic signals. Conf Proc IEEE Eng Med Biol Soc. 2009b;2009:5010–5013. - PubMed
Publication types
MeSH terms
LinkOut - more resources
Full Text Sources
Other Literature Sources