. 2010 Aug;27(8):1877-85.
doi: 10.1093/molbev/msq067. Epub 2010 Mar 4.

Phylogeography takes a relaxed random walk in continuous space and time

Affiliations

Phylogeography takes a relaxed random walk in continuous space and time

Philippe Lemey et al. Mol Biol Evol. 2010 Aug.

Abstract

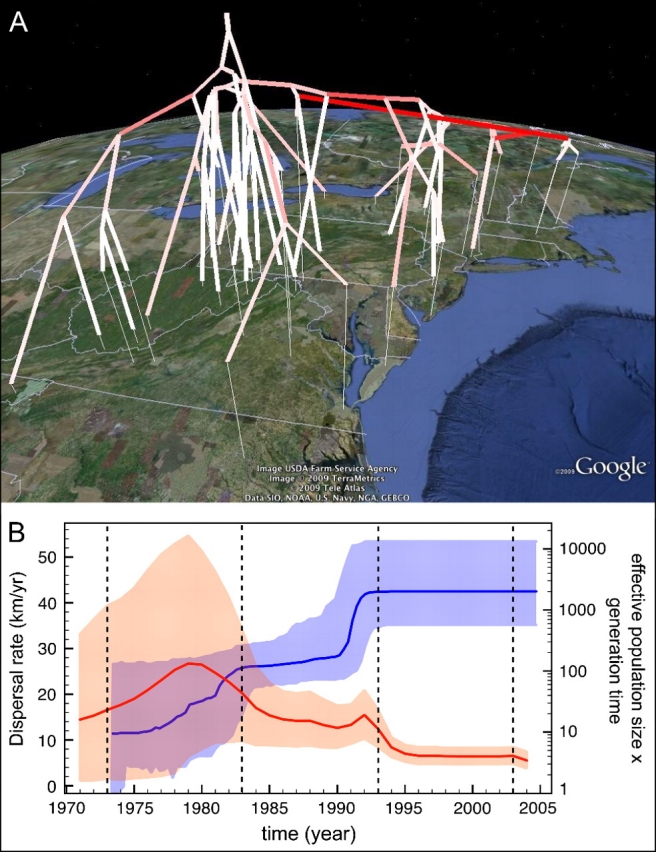
Research aimed at understanding the geographic context of evolutionary histories is burgeoning across biological disciplines. Recent endeavors attempt to interpret contemporaneous genetic variation in the light of increasingly detailed geographical and environmental observations. Such interest has promoted the development of phylogeographic inference techniques that explicitly aim to integrate such heterogeneous data. One promising development involves reconstructing phylogeographic history on a continuous landscape. Here, we present a Bayesian statistical approach to infer continuous phylogeographic diffusion using random walk models while simultaneously reconstructing the evolutionary history in time from molecular sequence data. Moreover, by accommodating branch-specific variation in dispersal rates, we relax the most restrictive assumption of the standard Brownian diffusion process and demonstrate increased statistical efficiency in spatial reconstructions of overdispersed random walks by analyzing both simulated and real viral genetic data. We further illustrate how drawing inference about summary statistics from a fully specified stochastic process over both sequence evolution and spatial movement reveals important characteristics of a rabies epidemic. Together with recent advances in discrete phylogeographic inference, the continuous model developments furnish a flexible statistical framework for biogeographical reconstructions that is easily expanded upon to accommodate various landscape genetic features.


Figures

F<sc>IG</sc>. 1.
FIG. 1.
Results for a two-by-two simulation experiment that fits both the time-homogeneous BD and RRW models to data simulated under homogeneous and overdispersed diffusion. (A) Estimator coverage for the precision matrix parameters and the root location realizations. (B) Percentage reduction of the MSE for the RRW over the BD models when fitting to overdispersed data.
F<sc>IG</sc>. 2.
FIG. 2.
Evaluation of IS estimates of the marginal likelihood to compare diffusion model fit. The thick black curve summarizes the two-by-two comparisons of BD and RRW models from which the overdispersed diffusion was simulated using a lognormal distribution with a standard deviation of 1.7. The open circle symbols along the colorized curve represent different BF cutoff values. The four different precision matrix parameterizations generated comparisons that resulted in very similar curves, making them appear as single result. Additional simulations of 100 data sets were generated using lower lognormal standard deviations and one particular precision matrix (p1=7.7, p2 = 6.7, and r = 0.4).
F<sc>IG</sc>. 3.
FIG. 3.
(A) Rabies epidemic MCC rooted phylogeny for the RRW analysis visualized using Google Earth (http://earth.google.com). The height of the nodes in the phylogeny are proportional to posterior mean heights in time-units relative to the most recent sampling date. For older samples, the tip sampling location is projected onto the surface. The white–red color gradient informs the relative diffusion rate (slow–fast). The maps are based on satellite pictures made available in Google Earth. (B) Rabies epidemic diffusion rate summary through time (posterior mean = red line, 95% HPD = transparent red surface) superimposed on the demographic reconstruction (posterior mean = blue line, 95% HPD = transparent blue surface) using the Bayesian skyline plot model. Vertical dashed lines mark the time slices for which we provide visual summaries of rabies spread in figure 4.
F<sc>IG</sc>. 4.
FIG. 4.
Spatiotemporal dynamics of the rabies epidemic among North American raccoons. We provide snapshots of the dispersal pattern for August 1973, 1983, 1993, and 2003. Lines represent MCC phylogeny branches projected on the surface. The uncertainty on the location of raccoon rabies is represented by transparent polygons. These 80% HPD regions are obtained by contouring a time slice of the posterior phylogeny distribution and imputing the location on each branch in each phylogeny using the precision matrix parameters for the respective sample. The white–red color gradient informs the relative age of the dispersal pattern (older–recent). A green circle marks Pendleton County, WV, where the epizootic's first case was reported in 1977. The maps are based on satellite pictures made available in Google Earth (http://earth.google.com). A dynamic visualization of the spatiotemporal reconstruction can be explored at http://www.phylogeography.org/.

References

    1. Andrews D, Mallows C. Scale mixtures of normal distributions. J R Stat Soc Series B. 1974;36:99–102.
    1. Berger J, Jefferys W. Ockham's razor and Bayesian analysis. Am Sci. 1992;80:64–72.
    1. Biek R, Henderson JC, Waller LA, Rupprecht CE, Real LA. A high-resolution genetic signature of demographic and spatial expansion in epizootic rabies virus. Proc Natl Acad Sci U S A. 2007;104:7993–7998. - PMC - PubMed
    1. Brown R. A brief account of microscopical observations made in the months of June, July and August, 1827, on the particles contained in the pollen of plants; and on the general existence of active molecules in organic and inorganic bodies. Philos Mag. 1828;4:161–173.
    1. Butler M, King A. Phylogenetic comparative analysis: a modeling approach for adaptive evolution. Am Nat. 2004;164:683–695. - PubMed

Publication types