Review
. 2010 Mar 5;106(4):659-73.
doi: 10.1161/CIRCRESAHA.109.206078.

A coupled SYSTEM of intracellular Ca2+ clocks and surface membrane voltage clocks controls the timekeeping mechanism of the heart's pacemaker

Affiliations
Review

A coupled SYSTEM of intracellular Ca2+ clocks and surface membrane voltage clocks controls the timekeeping mechanism of the heart's pacemaker

Edward G Lakatta et al. Circ Res. .

Abstract

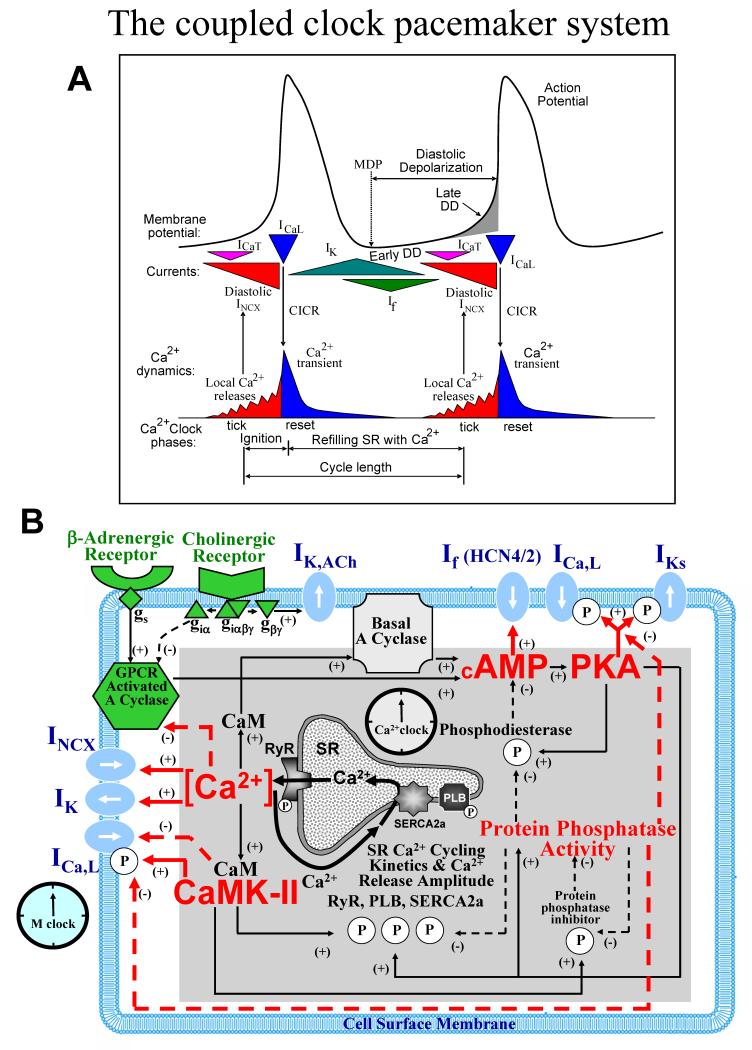
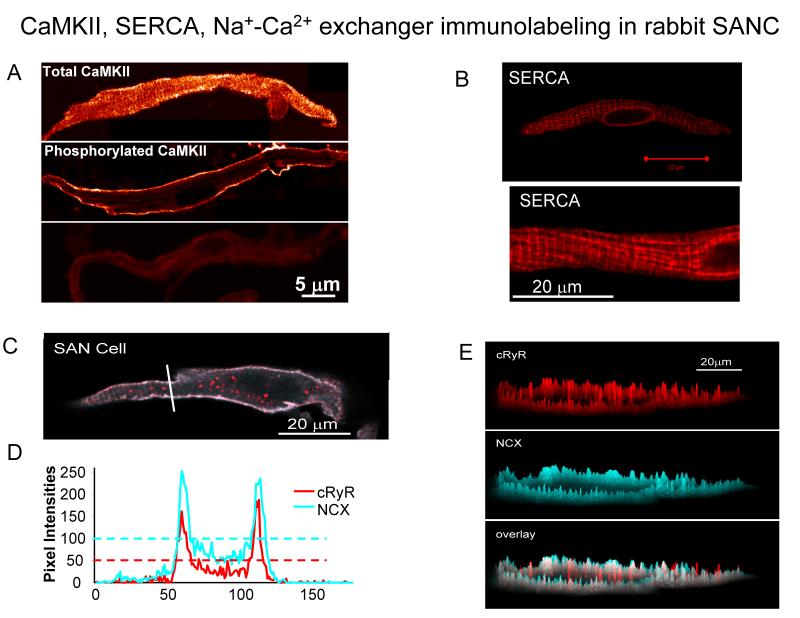
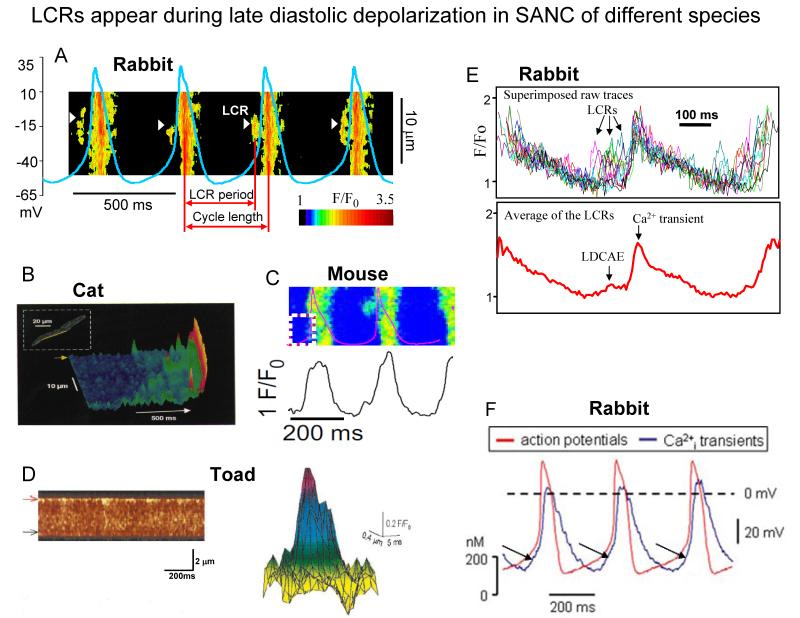
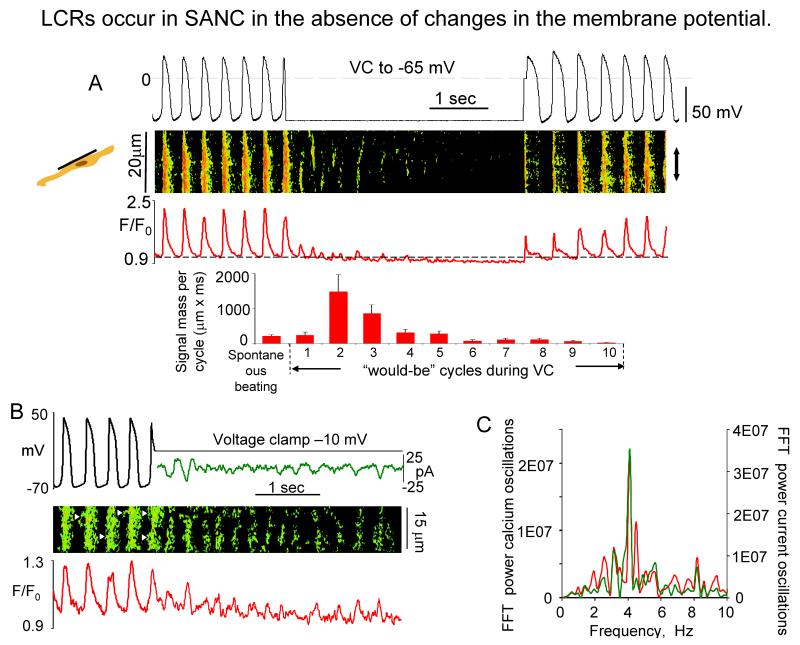
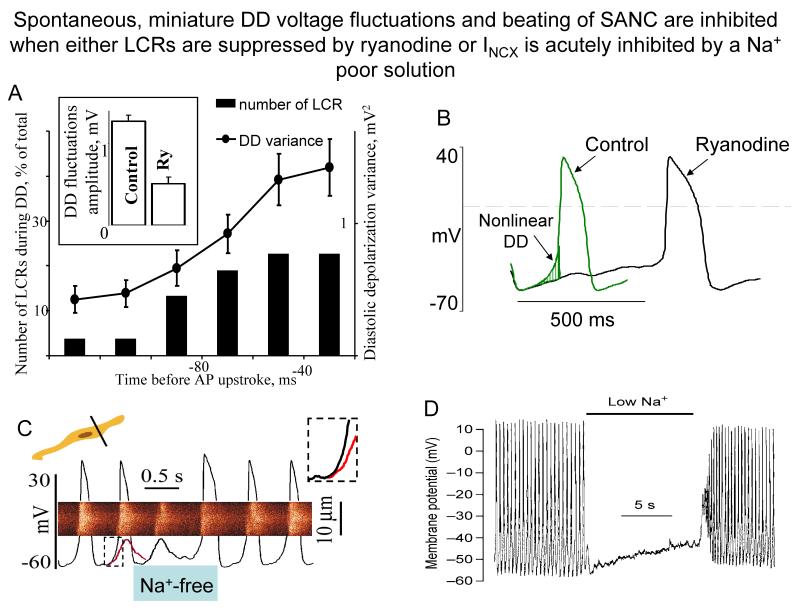
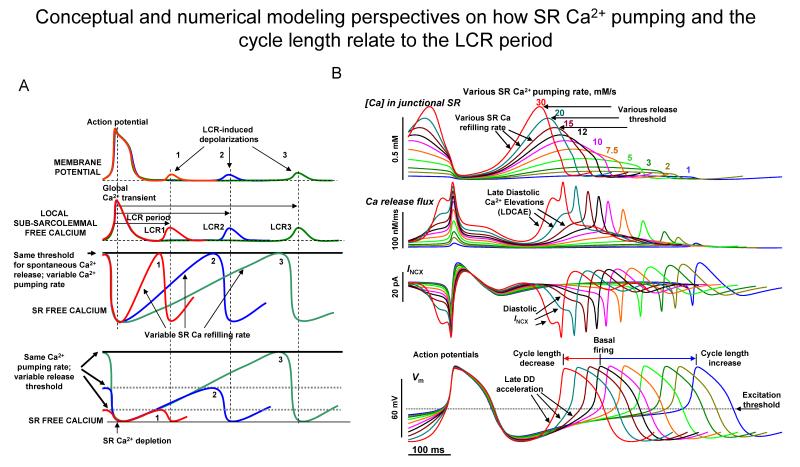
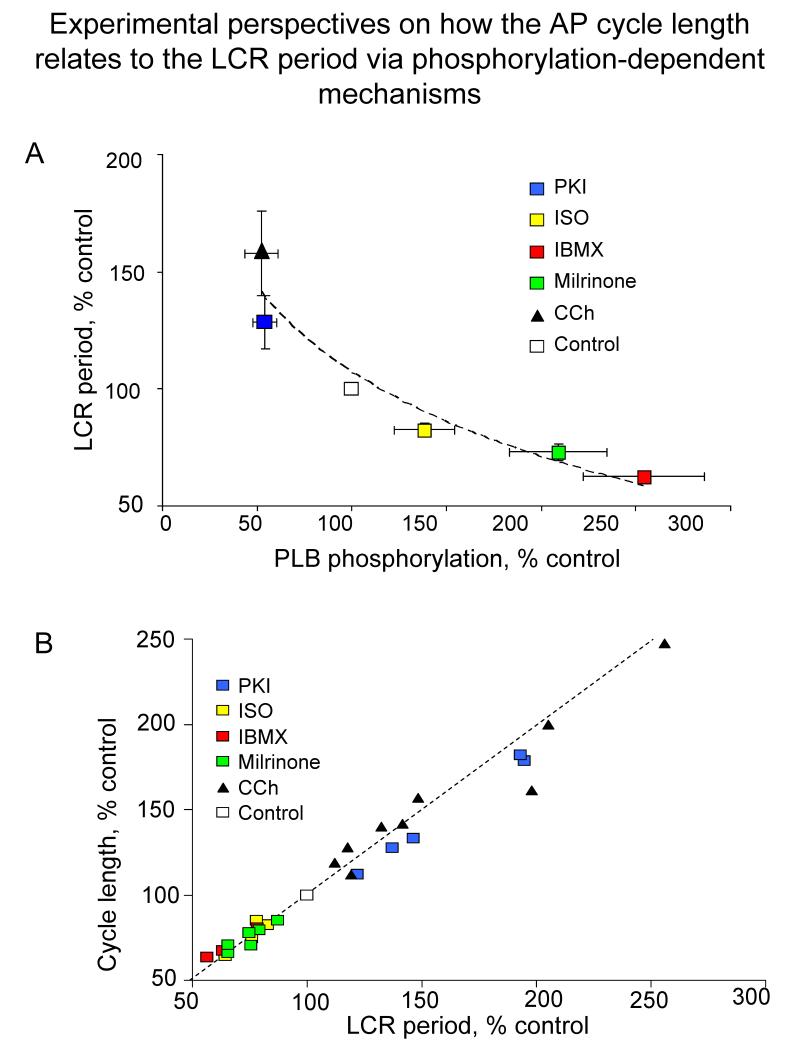
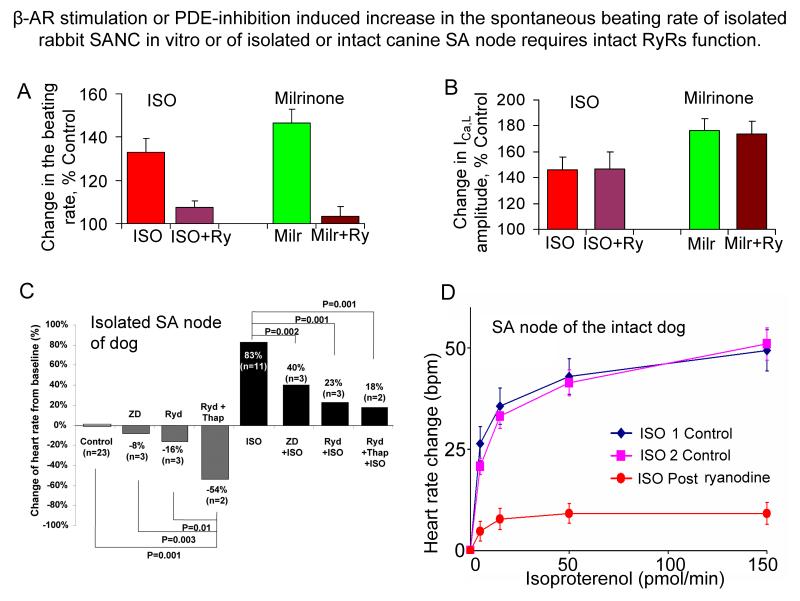
Ion channels on the surface membrane of sinoatrial nodal pacemaker cells (SANCs) are the proximal cause of an action potential. Each individual channel type has been thoroughly characterized under voltage clamp, and the ensemble of the ion channel currents reconstructed in silico generates rhythmic action potentials. Thus, this ensemble can be envisioned as a surface "membrane clock" (M clock). Localized subsarcolemmal Ca(2+) releases are generated by the sarcoplasmic reticulum via ryanodine receptors during late diastolic depolarization and are referred to as an intracellular "Ca(2+) clock," because their spontaneous occurrence is periodic during voltage clamp or in detergent-permeabilized SANCs, and in silico as well. In spontaneously firing SANCs, the M and Ca(2+) clocks do not operate in isolation but work together via numerous interactions modulated by membrane voltage, subsarcolemmal Ca(2+), and protein kinase A and CaMKII-dependent protein phosphorylation. Through these interactions, the 2 subsystem clocks become mutually entrained to form a robust, stable, coupled-clock system that drives normal cardiac pacemaker cell automaticity. G protein-coupled receptors signaling creates pacemaker flexibility, ie, effects changes in the rhythmic action potential firing rate, by impacting on these very same factors that regulate robust basal coupled-clock system function. This review examines evidence that forms the basis of this coupled-clock system concept in cardiac SANCs.


Figures

Fig.1
Fig.1. The coupled-clock pacemaker system
A. Schematic illustration of key phases of the functional interactions between M clock and Ca2+ clocks. Modified from. B. Schematic illustration of interactions of molecules comprising the full coupled-pacemaker clock. Note that the same regulatory factors (red lettering) of the SR Ca2+ clock (gray intracellular area, black lettering) couple the Ca2+ clock to the M clock (blue membrane area, blue lettering). G protein-coupled receptors (green lettering) regulate both the Ca2+ clock and membrane clock via those same factors (red lettering) and other coupling factors (green shapes). See text for numerous additional details. Modified from.
Fig.2
Fig.2. CaMKII, SERCA, RyR and NCX immunolabeling in rabbit SANC
A. The intracellular distribution of total and active CaMKII in SANC. A uniform distribution of the total CaMKII immunolabeling (top); the localization of active CaMKII beneath the sarcolemmal membrane (middle); the negative control (bottom), i.e., in the absence of the primary antibodies (from49). B SERCA labeling in the single rabbit SANC. C, Confocal image of SANC double immunolabeled for NCX and RyR. D, pixel-by-pixel fluorescence intensities of labeling along an arbitrary (white) line in panel C. The horizontal dashed lines show the average pixel intensity. E, Topographical profiles of the pixel intensity levels of each antibody labeling and overlay in the small SANC in panel C. The maximum height represents the brightest possible pixel in the source image. B-E from.
Fig. 3
Fig. 3. LCR appear during late diastolic depolarization in SANC of different species
A. Line-scan image of LCRs with superimposed spontaneous APs in rabbit SANC. White arrowheads show LCRs. The LCR period is defined as indicated. Modified from. B. local Ca2+ releases in cat latent pacemaker cells (from, with permission). C, A line-scan image of LCRs with superimposed spontaneous APs in a mouse SANC (from, with permission). D. Ca2+ sparks in toad pacemaker cells: (left) a line-scan image showing regions of localised, transient increase in fluorescence along the upper border of the toad pacemaker cell; (right) intensity map of fluorescence of a composite spark obtained by superimposing 11 sparks (from, with permission). E. Confocally measured subsarcolemmal LCRs (upper panel) in rabbit SANC. The temporal average of the individual LCRs within each cycle (lower panel) generates Late Diastolic Ca2+ Elevation (LDCAE) that precedes Ca2+ transient induced by action potential. Modified from. F. Superimposed APs (red trace) and associated Ca2+ transients (blue trace) recorded in rabbit SANC (LDCAE are indicated by arrows) (from, with permission).
Fig. 4
Fig. 4. LCR occur in SANC the absence of changes in membrane potential
A. (top) Simultaneous recordings of APs, linescan image and normalized subsarcolemmal fluorescence averaged spatially over the band indicated by doubleheaded arrow in a representative SANC prior to, during, and following acute voltage clamp at the maximum diastolic potential (from17); (bottom) Average total LCR signal mass in 9 cells in control during spontaneous beating, and during each “would-be” cycle of voltage clamp. B, Simultaneous recordings of membrane potentials or current (top), confocal line-scan image (middle), and normalized fluo-3 fluorescence (bottom) averaged over the line-scan image, in a representative spontaneously beating SANC before and during voltage clamp to −10 mV. Fast Fourier transform (FFT) of Ca2+ and membrane current fluctuations during voltage clamp to −10 mV (from18).
Figure 5
Figure 5. Spontaneous miniature DD voltage fluctuations and beating of SANC are inhibited when either LCRs are suppressed by ryanodine or INCX is acutely inhibited by a Na+ poor solution
A. Time course of DD variance (dots) and of the relative LCRs occurrence (bars) observed at different times during the measurement period (24 SANC). Inset shows that the average amplitude of DD fluctuations, calculated for the 50-ms segment preceding AP upstroke, is suppressed by ryanodine (from27). B. Superimposed APs of representative rabbit SANC before and after treatment with 3 μmol/L ryanodine (from13). C. Linescan image of Ca2+ release with superimposed AP records during rapid sprits with Na+ free solution. Red curve superimposed on the last AP preceding spritz of Na+ free solution is a copy of the residual membrane potential oscillation observed during Na+-free solution spritz. Note that this maneuver suppressed late DD (see inset) and blocked the subsequent AP firing. (from19). D. A rapid switch to low-Na+ solution (during the time indicated by the bar) caused immediate cessation of spontaneous action potentials in guinea-pig SANC. Action potentials speedily reappeared following rapid switch back to normal Na+ solution (with permission from29).
Figure 6
Figure 6. Conceptual and numerical modeling perspectives on how SR Ca2+ pumping and the cycle length relate to the LCR period
A. Schematic illustration of the concept that the rate of SR Ca2+ refilling and Ca2+ release threshold determine the LCR period, and the timing of the LCR induced diastolic depolarization (Modified from105). B. A novel numerical SANC model of a dynamically integrated system of Ca2+ and membrane clocks predicts the wide range of pacemaker rate modulation via variations in SR Ca2+ pumping rate (color coded, 1 to 30 mmol/s), mimicking various degrees of PKA-dependent phospholamban phosphorylation. Shown are simulations of SR [Ca2+], SR Ca2+ release flux, INCX, and Vm.
Figure 7
Figure 7. Experimental perspectives on how the AP cycle length relates to the LCR period via phosphorylation-dependent mechanisms
A. The relative effects of a PKA inhibitor PKI, carbachol (CCh), PDE inhibition (IBMX, milrinone) and isoproterenol (ISO) to alter the LCR period are linked to their effects to alter phospholamban (PLB) phosphorylation. The dashed line is the best fit least squares logarithmic function through the points: Y= −52.01 ln(X) + 107.11. B. The relative effects of PKI, CCh, PDE inhibition and ISO to alter the spontaneous cycle length over a wide range are linked to their effects on the LCR period. The best fit least squares linear functions (dashed line) through the points is: cycle length = 0.89 LCR period + 11.43 msec.
Figure 8
Figure 8. β-AR stimulation or PDE-inhibition induced increase in spontaneous beating rate of isolated rabbit SANC in vitro or of isolated or intact canine SA node requires intact RyRs function
A. Changes of rabbit SANC firing rate by β-AR stimulation or PDE inhibition in the presence and absence of ryanodine. B. The increase in L-type Ca2+ current by β-AR stimulation or PDE inhibition is not affected when RyR Ca2+ release in rabbit SANC is inhibited by ryanodine. C. Changes in the canine heart rate (percent from baseline) induced by different pharmacological interventions. The gray bars show the changes during 3 μmol/L ZD 7288 (If channel inhibitor, ZD), 3 μmol/L ryanodine (Ryd), and 10 μmol/L ryanodine plus 200 nmol/L thapsigargin (Ryd+Thap) infusion without isoproterenol (ISO), and black bars during 1 μmol/L ISO infusion (with permission from23). D. The increase of the heart rate of intact canines in response to sequential ISO infusions (two control infusions followed by a third graded-dose infusion in the presence of ryanodine) delivered by microdialysis into the SA nodal artery: ISO produces a brisk, reproducible dose-dependent tachycardia, and sequential dose responses in control are superimposable. Disabling of RyRs with ryanodine (5 nmol/min) following the second control ISO infusion dramatically reduces the effects of the next ISO infusion to increase the in vivo heart rate. Local nodal dialysis with ryanodine prior to the third ISO infusion reduced resting heart rate by 12% (from 108 ± 5 to 96 ± 6 bpm; P < 0.05), and suppressed the subsequent response to ISO by 75% (from18).

Similar articles

Cited by

References

    1. Irisawa H, Brown HF, Giles W. Cardiac pacemaking in the sinoatrial node. Physiol Rev. 1993;73:197–227. - PubMed
    1. Baruscotti M, Barbuti A, Bucchi A. The cardiac pacemaker current. J Mol Cell Cardiol. 2009 (in print) - PubMed
    1. Mangoni ME, Nargeot J. Genesis and regulation of the heart automaticity. Physiol Rev. 2008;88:919–982. - PubMed
    1. Wilders R. Computer modelling of the sinoatrial node. Med Biol Eng Comput. 2007;45:189–207. - PubMed
    1. Rubenstein DS, Lipsius SL. Mechanisms of automaticity in subsidiary pacemakers from cat right atrium. Circ Res. 1989;64:648–657. - PubMed

Publication types

Substances